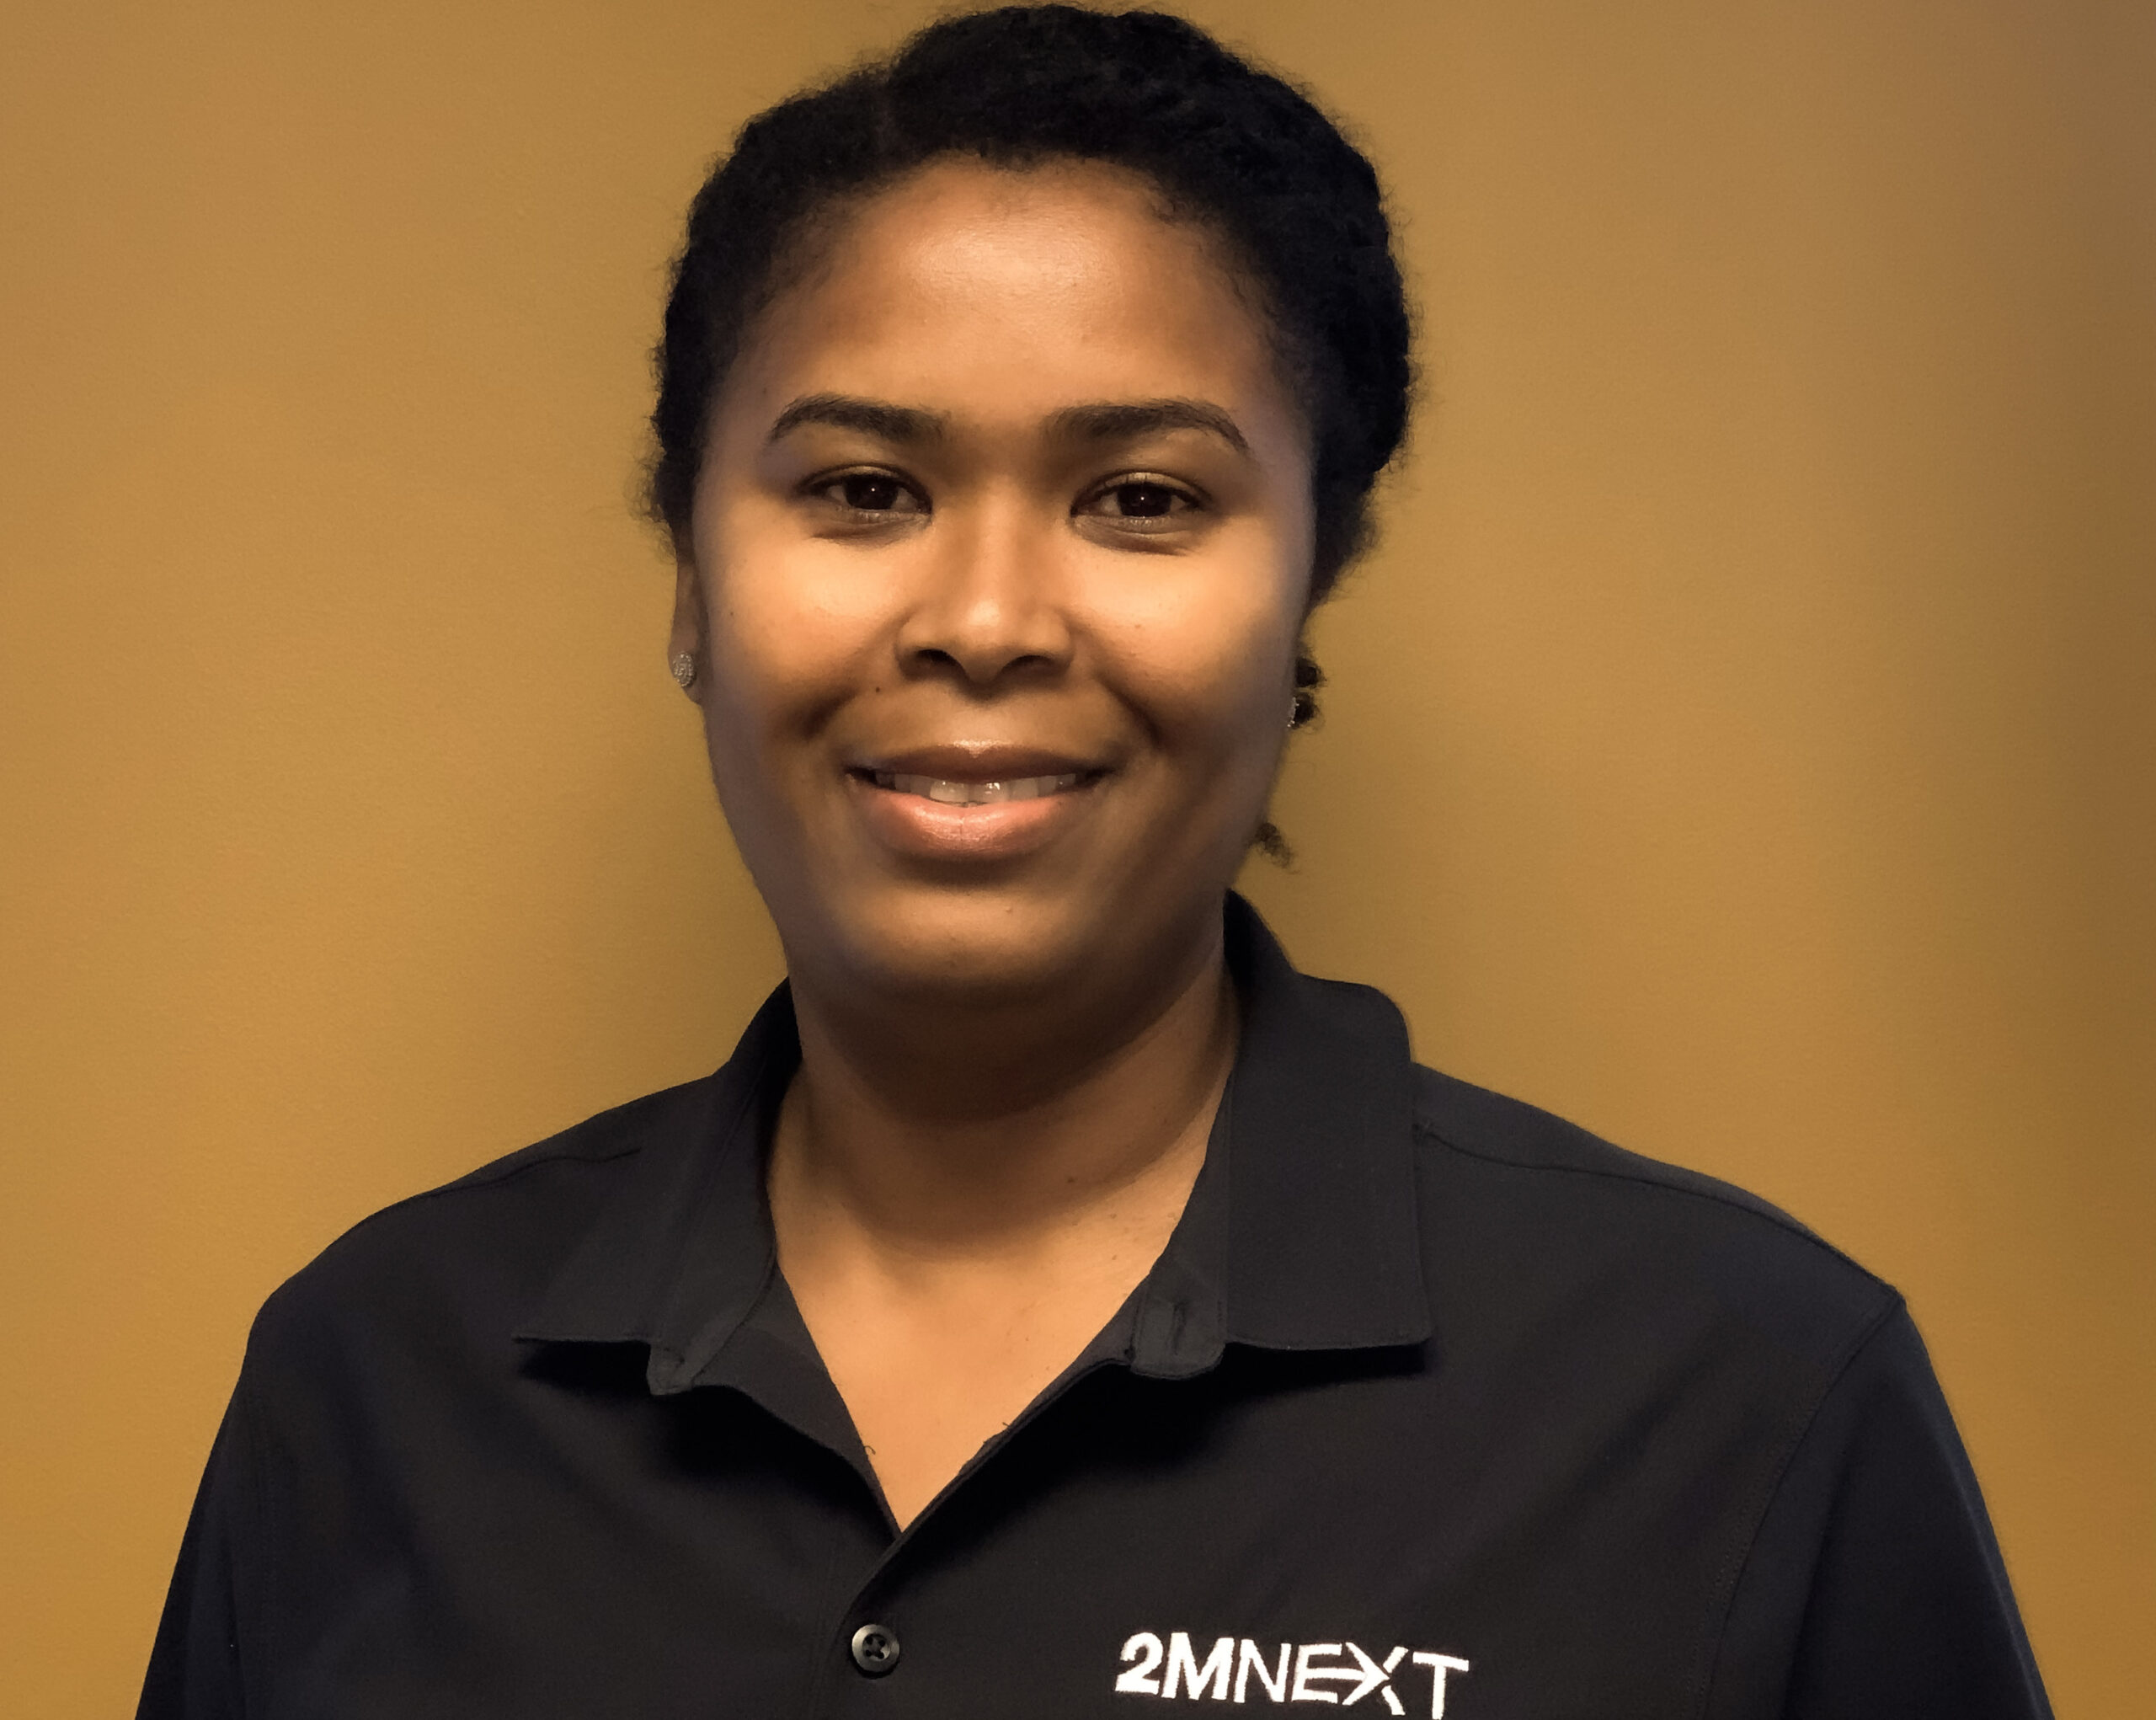
404.961.5279
info@2mnext.com
2MNext®
  • HOME
  • SERVICES
    • Geotechnical Engineering
    • Geoenvironmental Engineering
    • Materials Engineering & Testing
    • Special Inspection Services
    • Construction Engineering Inspection (CEI) & RTT Services
    • Pavement Management
    • Portfolio
  • NEWS
  • CAREERS
  • ABOUT
    • VISION AND VALUES
    • LEADERSHIP
    • QUALIFICATIONS
    • AFFILIATIONS
  • CONTACT
  • Home
  • Author: Administrator

Author: Administrator

News-13-October-2016_CEI-GA-DOT.jpg

2MNEXT adds GDOT Pre-Qualification in Work Group 8

October 13, 2016News

Atlanta, GA. 2MNEXT is pleased to announce the addition of Anu Saxena, P.E. as Chief Strategy Officer / Chief Operations Officer, Executive Vice President, and Managing Principal Engineer. In this role, Anu will help direct and manage the firm’s diversification, growth, and expansion into key services and geographies.

CONTINUE READING

atlanta-beltline-logo.jpg

Atlanta BeltLine Inc, awards next phase to 2MNEXT, The Eastside Trail Southern Extension

May 16, 2016News

Atlanta, GA. 2MNEXT is pleased to announce the addition of Anu Saxena, P.E. as Chief Strategy Officer / Chief Operations Officer, Executive Vice President, and Managing Principal Engineer. In this role, Anu will help direct and manage the firm’s diversification, growth, and expansion into key services and geographies.

CONTINUE READING

2014-01_technical-paper_Prague-1.jpg

Innovative and Durable Repair Solutions for Concrete Pavement at Hartsfield- Jackson Atlanta International Airport

January 1, 2014Technical Paper

Download PDF


W. Charles Greer, Jr., P.E.
AMEC Environment & Infrastructure, Inc., Alpharetta, GA, USA

Subash Reddy Kuchikulla
Materials Managers and Engineers, Inc., Atlanta, GA, USA

John Rone and James L. Drinkard
Hartsfield-Jackson Atlanta International Airport, Atlanta, GA, USA

ABSTRACT: The busiest airport in the world, Hartsfield-Jackson Atlanta International Airport (ATL), served more than 94 million passengers with over 911,000 aircraft operations in 2013. The planning and execution of maintenance and repair (M&R) activities in an efficient manner with minimal impact on operations is a critical priority. This requires M&R activities that are innovative, executed quickly and effectively during short night time shutdowns yet provide long-lasting durable concrete repairs. This paper focuses on the identification of the distresses, the determination of the type and scope of M&R, and the planning, design, and execution of the activities, the field time for which is often measured in hours and minutes. The ATL M&R Program has two elements: (1) Emergency Repairs and (2) Annual Repairs. Activities are aimed at preserving assets and improving safety. Typical distresses to be repaired include joint seal damage, crack routing and sealing, joint spalls, general pavement spalls, utility conduit spalls, trench drain distress, and full depth slab replacement.

Emergency repairs utilize materials such as methyl methylmethacrylate because asphalt patches usually have to be replaced in less than a year. Emergency repairs are typically performed to reduce foreign object debris potential of a spall and are considered temporary.

The Annual Repair Program is used to promptly address and implement the required repairs that are identified through the annual inspection program. Repairs are typically performed to tight time schedules during relatively short night time closures. Repairs for spalls include a bonding agent, steel tie bars, and steel fiber (more recently polypropylene fiber) reinforced concrete and these have resulted in very good long term performance of the repairs.

KEY WORDS: Concrete, Pavement, Distress, Maintenance, Repair, Materials

1. BACKGROUND

The age of the concrete pavements at ATL range from less than 5 years to more than 40 years. The concrete pavements have typically served well beyond their original design life of 20 years. Runway 9L-27R is one of two main departure runways and the interior 2439 m (8,000 feet) is 40 years old in 2014. The 1984 extensions to this runway are 30 years old in 2014. It has served an estimated 8 million departures. Runway 8L-26R, a main landing runway, is also 30 years old in 2014.

2. ANNUAL REPAIR PROGRAM

The Annual Repair Program is used to identify and establish the extent of on-going M&R to be accomplished each year. Prior to 2007, a repair program was executed every 2 to 3 years. Starting in 2007, the program became the Annual Repair Program. M&R accomplished under this program has increased from 2 million dollars (US) per year in the beginning to approximately 4 million dollars (US) in the current year. The replacement value of the concrete pavement at ATL is estimated to be approximately 2 billion dollars (US). The Annual Repair Program represents a mere 0.1 to 0.2 percent of the replacement value. The program is generally focused on the following types of repairs: joint sealing, crack routing and sealing, spalls, utility conduit spalls, trench drains, and full depth slab replacement. Typical examples of these distresses at ATL are shown in Figures 1 and 2. The repairs made under the Annual Repair Program are intended to be long lasting and permanent.

2014-01_technical-paper_prague-1

Figure 1: Typical spall distress.

The location and extent of each individual distress is determined by a walking visual inspection process. Inspection is performed for the runways and taxiways all of which are concrete and cover approximately 2.1 million square meters (23 million square feet, more than 500 acres). The inspection of the runways and taxiways requires approximately 16 to 18 nights with approximately 120,000 square meters (1.3 million square feet, 30 acres) inspected each night.

When a spall distress is observed during the inspection program the area is sounded with a steel dowel bar to establish the lateral extent of the area of loose or delaminated concrete. The perimeter is marked with bright orange or yellow paint and the severity is classified subjectively as low, medium, or high. The location is surveyed with a Global Positioning (GPS) unit in a mode capable of plus or minus 30 cm (12 inches) or less. The vertices of the spall are surveyed starting at the southwest vertex and proceeding counterclockwise. Each vertex has a number assigned in the database when it is entered in the GPS unit. One of these numbers is assigned as the distress number for the spall in the database and it is painted on the pavement surface.

2014-01_technical-paper_prague-2

Figure 2: Typical crack routing and sealing distress.

For cracks and joint seal damage, the endpoints of the crack or damaged/missing joint seal are surveyed with the GPS. The vertices of abrupt changes in direction are also surveyed and recorded for the distress. The cracks and missing joint seal distresses are not numbered due to time constraints.

The most common distress in terms of frequency is spalling along longitudinal or transverse joints. These are typically due to failure of the female side of keyways in the longitudinal joints or failure to maintain proper separation across a joint when previous spalls were repaired as shown in Figure 3. Keyways have not been used in pavements constructed at ATL since the early 1980’s (Greer, Kuchikulla, Masters and Rone, 2013). The spall may also be an area where a previous patch has come loose or delaminated.

2014-01_technical-paper_prague-3

Figure 3: Failure to maintain proper joint alignment and continuity — future distress.

Joint seal damage has generally been the result of failure of the bond between the sealant material and the adjacent concrete to which it was bonded. This has been attributed to failure to properly clean and/or dry the concrete surface prior to placement of the sealant material.

3. STANDARD REPAIR CONCEPTS

A key factor in the establishment of durable PCC repairs at ATL has been the development of standard repair concepts followed by implementation of these concepts in the design of the repairs. Patching of spalls is one of the most common repairs at ATL. For over 25 years, the concept for repair of spalls has involved removal of the distressed concrete down to sound concrete that is relatively level with planar sides through sawing, bush hammering and cleaning of the exposed surface. Vertical holes are drilled into the bottom of the area to be patched along the sides where the adjacent joints are located. The holes are maintained at least 5 cm (2 inches) from the edge of the joint. No. 4 (13 mm or 1/2 inch) reinforcing steel bars are then epoxied in the holes. Holes are drilled in the exposed sides opposite the joint sides of the patch area in a downward direction at approximately 45o with the horizontal. No. 4 bars with a 45o bend are then epoxied in the holes. The bent bars are not installed across the joints so that proper joint movement can still occur.

A horizontal reinforcing steel mat of No. 4 bars, with a variable spacing each way, is then placed so that a cover of 40 mm (1.5 inches) over the steel can be maintained. A tolerance of 13 mm (1/2 inch) is allowed for the cover of the steel mat. The variable spacing for the bars in the steel mat is a minimum of 15 cm (6 inches) to a maximum spacing of 30 cm (12 inches) on center. The steel generally provides a tensile attachment of the patch to the sound concrete that far exceeds the tensile capacity of the sound concrete. The steel also provides integrity to the patch should cracks develop in the replacement concrete. Fiberboard 13 mm (1/2 inch) thick is used at the faces of adjacent slabs in order to maintain a proper joint separation between the repair concrete and the concrete in the adjacent slabs. Figure 4 shows a schematic for a spall repair patch adjacent to 2 joints. Figure 5 shows an actual repair adjacent to 2 joints ready to receive replacement concrete.

2014-01_technical-paper_prague-4

Figure 4: Schematic drawing for spall repair.

A neat cement grout made with high early strength cement is placed on the exposed concrete immediately prior to placement of the replacement concrete. The replacement concrete contains high early strength cement at the rate of 534 kg per cubic meter (900 lbs per cubic yard). The aggregate is a single size No. 7 (ASTM C 33), 19 mm (3/4 inch). The mix also contains polymer fibers (steel fibers were used until the recent past) to provide additional integrity to the patch should any cracks develop in the patch concrete. The flexural strength is specified to be 3105 kPa (450 psi) at 4 hours and 4830 kPa (700 psi) at 24 hours. The patch operation is scheduled at night and in a timeframe such that the patch can cure for 4 hours before opening to traffic. Patches made in this manner have served and are still serving well under traffic after more than 20 years. The joint sealant is placed once the all the repairs have been made so that the contractor only has to mobilize once.

2014-01_technical-paper_prague-5

Figure 5: Spall repair showing reinforcing and tie bars to sound concrete below.

Another common repair is sealing of cracks in the surface of the PCC slabs. This is accomplished by routing the crack out to a width of 9 mm (3/8 inch). The routed crack is then sandblasted and cleaned by blowing debris out of the routed crack with an air wand. A backer rod is then inserted in the routed crack followed by installation of the sealant. The sealant material used is Dow 888 or approved equivalent.

4. CASE HISTORY – CONCRETE PAVEMENT DISTRESS AND REPAIR FOR TAXIWAY E

Over the years there have been some very interesting case histories regarding distress, investigation, evaluation, and repair at ATL. These have involved issues within the pavement layers and outside the pavement layers.

4.1 Taxiway E – Corner Cracking – Background

One of the more interesting and unique distresses observed at ATL was an issue involving corner cracking of the concrete slabs in Taxiway E. The corner cracking distress occurred along a portion of the taxiway for a distance of approximately 462 m (1500 feet). Over the last 40 years, this location and another section further to the east on Taxiway E have been the only places where this distress has been observed. The location further to the east was observed some years subsequent to the location discussed in this section of this paper. The taxiway was constructed as part of the midfield expansion for the Central Terminal Passenger Complex (CTPC) in the late 1970’s. The taxiway serves primarily outbound aircraft departures. The pavement consisted of 40 cm (16 inches) of plain Portland cement concrete (PCC) over 15 cm (6 inches) of cement treated base (CTB) over 15 cm (6 inches) of soil-cement (SC) over prepared subgrade. The specified 28 day flexural strength (third-point loading) for the PCC was 4480 kPa (650 psi). The 7 day compressive strengths for the CTB and SC were 5170 kPa (750 psi) and 2760 kPa (400 psi), respectively.

The PCC pavement consisted of three lanes 7.6 m (25 feet) wide placed with slipform paving techniques. Transverse joints were sawed at a spacing of 7.6 m (25 feet) longitudinally. The transverse joints were doweled with 38 mm (1-1/2 inch) diameter by 50 cm (20 inches) long steel dowels that were set in dowel baskets prior to placement of the concrete. The longitudinal joints were keyed and tied with deformed reinforcing bars 13 mm (1/2 inch) in diameter. The three lane configuration placed the longitudinal joints such that the main gears of the large commercial aircraft traversed on or very near the longitudinal joints. A visual inspection of the distress in Taxiway E was performed on February 20, 1987. Figure 6 shows a typical corner crack observed in the taxiway. There was also differential in the elevation of the top of the slabs across the transverse joint of approximately 3 to 6 mm (1/8 to 1/4 inch). This occurred even though the transverse joint was doweled as described previously.

2014-01_technical-paper_prague-6

Figure 6: Typical corner crack distress in Taxiway E.

During the visual inspection, a DC-8 aircraft that had just landed was taxied along the taxiway in the area of distress. The corner of one slab in the middle lane of pavement was observed to deflect visibly from a distance of approximately 7.6 m (25 feet) as one of the gears of the aircraft traversed the slab at the corner. The corner of the PCC slab that was observed to deflect was not yet cracked. This slab was designated as Slab 37B.

4.2 Engineering Investigation – Field

An engineering investigation consisting of coring of the PCC, CTB and SC along with conventional soil test borings with split spoon sampling (ASTM D 1586) to depths up to 5 to 21 m (16.5 to 68.5 feet) at 16 locations along the area of distress was performed. Undisturbed sampling (ASTM D 1587) of the subgrade soil was performed at periodic depths in the borings. The cores of PCC were 15 cm (6 inches) in diameter. The cores of CTB and SC were 10 cm (4 inches) in diameter.

One coring/boring was located in the deflecting corner of Slab 37B approximately 1.2 m (4 feet) from the corner along the diagonal of the slab. A void approximately 3 to 6 mm (1/8 to 1/4 inch) thick was encountered beneath the PCC and the top of CTB as shown in Figure 7. Voids ranging from 3 to 6 mm (1/8 to 1/4 inch) between the PCC and the CTB were encountered in 9 of the remaining 15 corings/borings.

2014-01_technical-paper_prague-7

Figure 7: Void between PCC and CTB in the coring/boring in Slab 37B in Taxiway E.

4.3 Engineering Investigation – Falling Weight Deflectometer

ATL has had a Pavement Management Program in place since 1984 that involves extensive testing with falling weight deflectometer (FWD) technology along with many other techniques. This program has been reported elsewhere in detail (Greer, Kuchikulla, and Drinkard, 2012). The 1987 program was performed in the January to February timeframe and the data were available for use in the evaluation of the taxiway. The FWD data included stiffness data for the center of slabs, the longitudinal joint near the mid-length of slabs, the transverse joint near the mid-width of slabs and the corners of slabs. Deflection based joint efficiencies across joints were determined for these joint locations. The joint efficiencies for the corner slabs were measured across the transverse joints at the corners.

4.4 Engineering Investigation – Laboratory

In the laboratory, the cores of PCC were cut near the mid-depth to establish a top and bottom portion for each core location in order to provide samples with length to diameter ratios in the range of 1.3 to 1. The ultrasonic pulse velocity (ASTM C 597) of the PCC cores was determined for the top and bottom portion of each core along the longitudinal axis of each core. The cores of PCC at 12 of the locations were subjected to split tensile tests (ASTM C 496) on the top and bottom portions of the cores. The compressive modulus of elasticity was determined on the top and bottom portions of the PCC cores from the remaining 4 locations (ASTM C 469). These cores were then subjected to compressive strength tests (ASTM C 39). All of the PCC cores were soaked for at least 40 hours in saturated limewater prior to the strength and modulus tests. The cores of CTB and SC that were testable were subjected to compressive strength tests after soaking for 40 hours in saturated limewater. Stress-strain data were collected during the compressive strength tests for the CTB and SC to allow calculation of the modulus of elasticity.

4.5 Engineering Investigation – Results

The results of the engineering investigation are summarized in the following paragraphs. The cores indicated voids 3 to 6 mm (1/8 to 1/4 inch) thick between the bottom of the PCC and the top of the CTB in 10 of the 16 cores. The soil test boring data did not indicate the likelihood of any unusual settlement or weakness of the subgrade soils. The standard penetration resistance values (ASTM D 1586) were typically 0.33 to 0.66 blows per cm (10 to 20 blows per foot). These values are typical for good subgrade soils at ATL. The strength tests on the cores of PCC, CTB, and SC indicated reasonable compliance with the specifications that were used for the original construction. Thus, it was concluded that the pavement support layers were of the quality expected for good support of the PCC and the voids and cracking were due to some other reason.

The FWD data indicated deflection based joint efficiencies across the transverse joints in the area of distress that ranged from 30 to 60 percent with an average of approximately 55 percent. The average longitudinal joint efficiency in the distressed area of the taxiway was approximately 50 percent. The average corner joint efficiency across transverse joints in the area of distress was approximately 34 percent. These values were significantly lower than typical joint efficiencies that were measured in other similar design pavements at ATL during the 1984 testing which was performed in the summer. It should be noted that the transverse joints for transverse and corner joint testing were dowelled.

4.6 Engineering Investigation – Additional Field and Laboratory Testing

In order to further investigate the issue of the deflecting but un-cracked slab, a large diameter core (LDC) was obtained at the corner of Slab 37B and included the corner of each of the other three slabs at the intersection of the transverse and longitudinal joint as shown in Figure 8. A void was expected between the PCC and CTB based on the coring and the visual observations during the passage of the DC-8 as discussed previously. The void and joints were “locked” in place by removing the joint sealant material in the area of the LDC and pouring epoxy into the transverse and longitudinal joints under gravity flow prior to the coring operation. The epoxy was fluid such that it could flow into the void between the PCC and the CTB. The epoxy was allowed to set for one day and the LDC was then cut with a 66 cm (26 inch) diameter diamond tipped rock core bit as shown in Figure 9.

The purpose of the LDC was to expose the area surrounding the interface between the PCC and the underlying CTB at the void without damage from crushing or demolition. The core was extended a short distance into the top of the CTB with the expectation that some of the CTB would be attached to the bottom of the core due to the epoxy. The core was carefully lifted out with an end loader and the hole was inspected and documented with photographs, two of which are shown in Figures 10 and 11.

2014-01_technical-paper_prague-8

Figure 8: Epoxy used to lock void in place at LDC location (37B).

2014-01_technical-paper_prague-9

Figure 9: Coring operation for LDC.

2014-01_technical-paper_prague-10

Figure 10: Void between bottom of PCC and CTB in LDC — void is 19 mm (3/4 inch).

2014-01_technical-paper_prague-11

Figure 11: “Sympathetic” crack in CTB below transverse joint crack in PCC in the LDC.

The following items of interest were observed in the hole left by the removal of the LDC:

  1. There was a void between the PCC and CTB approximately 3 to 19 mm (1/8 to 3/4 inch) thick near the intersection of the transverse and longitudinal joint (see Figure 10. This was significantly greater than the 3 to 6 mm (1/8 to 1/4 inch) void at the coring/boring location that was approximately 1.2 m (4 feet) from the intersection of the transverse and longitudinal joints along the diagonal of the slab. This indicates that the thickness of the void increased with decreased distance from the intersection. The void also existed beneath Slab 36B on the other side of the transverse joint. The slabs were curled upward at the corners.
  2. The cracked portion of the transverse joint below the saw cut exhibited an opening of approximately 3 mm (1/8 inch) in the “joint”.
  3. There was a “sympathetic” crack in the CTB beneath the cracked portion of the PCC below transverse joint saw cut as shown in Figure 11. This indicates that the CTB likely cracked when the concrete above it cracked below the transverse joint saw cut.
  4. The surface of the PCC across the transverse joint in the LDC was offset vertically by approximately 3 mm (1/8 inch) even though the transverse joint within the LDC had 2 dowels contained in it.

The LDC was returned to the laboratory where it was sawed such that an approximately 10 cm (4 inch) wide vertical slice (top to bottom) could be obtained. The slice was positioned so that the dowel nearest the corner in Slab 37B was contained near the mid-width of the slice. Figure 12 shows the sawing equipment set-up on top of the LDC. Figure 13 shows the slice after sawing.

2014-01_technical-paper_prague-12

Figure 12: Set-up for sawing of LDC at laboratory.

The slice of the LDC was then x-rayed perpendicular to the side (i.e. parallel to the transverse joint) so the dowel could be observed in the x-ray film. This required several attempts in order to achieve an exposure time that did not “burn” the film and resulted in an acceptable image of the dowel across the transverse joint. Figure 14 shows the resulting xray with the image of the dowel and the surrounding concrete along with a portion of the dowel basket used to hold the dowel during the slipform paving process.

2014-01_technical-paper_prague-13

Figure 13: Slice of LDC with embedded dowel bar.

2014-01_technical-paper_prague-14

Figure 14: X-ray image of slice from LDC with embedded dowel bar.

The following items of interest were noted in the x-ray image:

  1. There was a small void on the top of the dowel on the “upstream” side (Slab 36B) of the transverse joint and small void on the bottom of the dowel on the “downstream” side (Slab 37B) of the transverse joint as shown in Figure 14. An examination of the void around the dowel indicated that the dowel was likely cast with a small void around it rather than the small void being the result of “wearing” of the dowel in the dowel hole. The cause of the small void around the dowel could not be determined with certainty. However, it could be the result of a slight amount of excess oil on the dowel at the time of construction or possibly due to a small shift in the position of the dowel while the concrete was still in a plastic state.
  2. The granitic gneiss large aggregate shown in Figure 15 indicates a vertical offset of 3 mm (1/8 inch) across the crack in the aggregate at the cracked portion of the transverse joint below the saw cut. This vertical offset matches that observed across the transverse joint at the top of the core.
  3. There was a layer of epoxy approximately 3 to 6 mm (1/8 to 1/4 inch) thick between the bottom of the PCC and the top of CTB. This was the epoxy that was poured into the joint under gravity flow to “lock” the joints and void in position before the coring operation.
  4. A styrofoam coffee cup was found cast into the concrete at the bottom of the PCC in the LDC. It was the opinion of the investigators that this did not have any effect on the issue of curling or cracking.

2014-01_technical-paper_prague-15

Figure 15: Note the vertical offset of 3 mm (1/8 inch) in the large aggregate. The styrofoam coffee cup (white material) was determined to be of no influence.

It was concluded that many of the PCC slabs in Taxiway E in the area of distress had curled and separated from the CTB. The void between the bottom of the PCC and the top of the CTB appeared to increase as distance to the intersection of the transverse and longitudinal joint decreased. The lateral extent of curling exceeded 1.2 m (4 feet) from the corner as measured along the diagonal of the slabs. The amount of vertical curl at the corner was as much as 19 mm (3/4 inch) as measured in the hole after removal of the LDC.

The corners of the slabs were eventually cracking in fatigue under the repeated loads of the large commercial aircraft main gears that tracked at or very near the longitudinal and corner joints. The curling was attributed to drying shrinkage and/or temperature differentials between the top and bottom of the PCC slabs.

4.7 Taxiway E Repair Plan

The repair plan was established as follows:

  1. Saw cut the outer lanes of the PCC slabs longitudinally at a distance of 3.5 m (11.5 feet) from the longitudinal joint between the outer lanes and the adjacent middle lane of PCC slabs. The saw cut was to be made full-depth through the PCC, CTB, and into the top 76 mm (3 inches) of the SC.
  2. An additional saw cut was to be made in the outer lanes of the PCC slabs longitudinally at a distance of 3.8 m (12.5 feet) from the longitudinal joint between the outer lanes and the adjacent middle lane of PCC slabs. The saw cut was to be made full-depth through the PCC and CTB. The intent of this cut was to provide a “buffer” zone, 30 cm (12 inches) wide, to allow demolition and removal of PCC and CTB without damage to the pavement that was to remain in place after the repair.
  3. Demolish and remove the middle lane and the “interior” portion of outer lanes of the PCC slabs and underlying CTB and SC.
  4. Remove the remaining 30 cm (12 inch) wide buffer zone strip of PCC at the outer edge of the “interior” portion of outer lanes of the PCC slabs along with the underlying CTB and SC.
  5. Construct 20 cm (8 inches) of CTB on top of the exposed subgrade.
  6. Place 56 cm (22 inches) of PCC in two lanes, each 7.6 m (25 feet) wide. This configuration would put the main gears of large commercial aircraft in the middle portions of the new PCC slabs.
  7. Saw cut transverse joints in the new PCC at a longitudinal spacing of 7.6 m (25 feet).
  8. Seal the transverse and longitudinal joints and open to traffic.

The repair was accomplished during the summer and fall of 1987.

4.8 Taxiway E Repair Execution – A Repair Issue with the Construction of the Repair

One major issue arose during the construction for the repair. The contractor chose to demolish the PCC with a “headache ball” process. The contractor sawed the in-place outer lanes of PCC slabs at the specified 3.5 m (11.5 feet) and 3.8 m (12.5 feet) distances from the longitudinal joint with the adjacent middle lane of PCC slabs. He then dropped the headache ball on the surface of the PCC slabs to be removed to crush them. The headache ball was “x-shaped”, weighed 5543 kg (12,000 pounds), and was dropped from a height of 1.8 to 2.4 m (6 to 8 feet) above the surface of the PCC. In general, 5 drops were made in an area approximately 60 cm (2 feet) in diameter before the weight was moved to a “new location”. The contractor attempted to keep the headache ball at least 38 cm (15 inches) away from the first longitudinal saw cut on each side of the removal area.

When the contractor removed the crushed PCC from between the two interior saw cuts, portions of the underneath side of the PCC slabs in the buffer zone were observed to have cracked, sheared, and broken. The cracked, sheared, and broken zone was evident in the bottom half of the PCC in the face of the 30 cm (12 inches) buffer zone strip of PCC. The shear was triangular in nature in a direction perpendicular to the face, the thickness decreased with increased depth into the face. The thickness of the shear break was typically in the range of 10 to 20 cm (4 to 8 inches) at the exposed face of the PCC and feathered out at 30 to 45 cm (12 to 18 inches) into the PCC. This indicated that the broken zone could extend as much as 15 cm (6 inches) into the PCC that was to remain in place after removal of the buffer zone. Figures 16 and 17 illustrate the cracked and sheared zone in the face of the PCC and the lateral extent into the PCC.

2014-01_technical-paper_prague-16

Figure 16: Typical cracked and sheared zone in saw cut face of PCC slab.

2014-01_technical-paper_prague-17

Figure 17: Cracked and sheared zone with pieces removed (Note depth into the PCC).

It was concluded that the headache ball was dropped too close to the saw cut and the crushed concrete was “bulking outward” against the vertical cut face of the buffer zone and the buffer zone concrete was applying a downward force on the face of the PCC that was to remain in place. This was supported by the fact that the outer second saw cut was that was observed to be closed; thereby indicating the buffer zone had moved outward. The downward shear forces were breaking or shearing the bottom of the buffer zone and the PCC slabs that were to remain in place. None of the cracking observed during the construction was encountered during the Engineering Investigation prior to the repair construction activities. Vibration monitoring was also performed during drops of the headache ball and indicated that the vibration velocities during the dropping of the headache ball were not high enough to cause cracking due to vibration.

The solution was to make a third longitudinal saw cut that was an additional 30 cm (12 inches) laterally beyond the buffer zone. This additional section of PCC was removed and this contained the sheared or broken zone at the bottom of the slabs. The contact location of the headache ball was also kept at least 1.8 m (6 feet) away from the additional longitudinal saw cut for the slab removal. The additional saw cut resulted in replacement slabs that were 7.9 m (26 feet) wide. No additional cracked or sheared zones were encountered after the change.

An interesting issue was noticed during the field inspection for the shear issue. The cracked portions below the saw cut for the transverse joints were closed so tight, that the only way to locate the cracked portions of the transverse joints was by looking below the bottom of the saw cuts for the transverse joints. The transverse joint at the LDC location exhibited a width in the cracked zone of approximately 3 mm (1/8 inch) during the February (winter) coring process. The other transverse joints exhibited crack widths that were hairline during the repair program that occurred in summer. This confirmed that thermal expansion of the PCC slabs had occurred with the heat of summer.

The replacement concrete pavement was still in place and serving well during the 2010 Pavement Management Program evaluation. The concrete was 23 years old and exhibited an average Pavement Condition Index of 69. The pavement continues to serve well and will be evaluated again as part of the 2014 Pavement Management Program evaluation. It is currently 27 years old.

5. CASE HISTORY – TAXIWAY D AND L INTERSECTION – UTILITY SLAB DISTRESS REPAIR

Sometimes repairs become necessary due to problems with previous construction or repair activities. One such case is illustrated in the following case history.

5.1 Taxiway D and L Utility Slab Distress – Background

During the Annual Inspection Program as well as more frequent routine general observations, significant distress was first noted around a Utility Slab in the intersection area of Taxiway D and Taxiway L in 2010. The initial distress at this location consisted of localized small spalls that had been repaired previously with routine procedures. These included sealing cracks and patching spalls in six slabs around a heavily reinforced utility slab associated with a manhole and underground drainage lines. The utility slab also had patches in it. The manhole was approximately 1.8 m (6 feet) in diameter and had an invert approximately 4.3 m (14 feet) below the pavement surface. The manhole structure served three incoming drainage pipes and one outgoing drainage pipe that were near the invert of the manhole structure. The incoming pipes included two reinforced concrete drainage pipes (RCP) approximately 40 cm (16 inches) in diameter and a corrugated metal pipe (CMP) approximately 61 cm (24 inches) in diameter. Monitoring over time indicated the need for additional spall repairs. Also, the observations indicated the initiation of cracks within the slabs in the area and indications of shallow depression of the pavement surface. The affected area encompassed 7 slabs that were each 7.6 m (25 feet) by 7.6 m (25 feet). Figure 18 shows the area of concern on June 11, 2010. The depth of the depression was not determined but was visible to the unaided eye.

2014-01_technical-paper_prague-18

Figure 18: General view of Utility Slab and distressed area in Taxiway D and L on June 11, 2010.

5.2 Engineering Investigation – Taxiway D and L

The distress continued to worsen and in late 2011, it was decided that the area needed to be investigated so a repair could be developed. In order to assess the situation, 2 locations were selected for coring of the PCC, CTB, and SC along with conventional soil test borings to depths of 7.6 m (25 feet) beneath the surface of the PCC. These were located just outside the general depressed area and were performed on November 8, 2011. The soil borings indicated high moisture contents in the subgrade soil. The same night a very limited closed circuit television (CCTV) recording was made of the 2 RCP and the CMP that entered the manhole. The CCTV information revealed an obstruction in the CMP approximately 1.2 m (4 feet) from the manhole. The blockage was thought to be a soil mass and water was observed dripping from the crown of the CMP. It was determined that the CMP was supposed to have been plugged and abandoned some years previous.

On November 18, 2011, three cores of the PCC were obtained in the area of depression. At one location, when the PCC was finally penetrated, the 46 cm (18 inches) long concrete core dropped out of the core barrel and onto its side at the bottom of a void at the bottom of the PCC. No CTB or SC was found beneath the PCC. The void was determined to have a depth of 63 cm (25 inches). Figure 19 shows the core laying on its side in the void. One of the other cores indicated a void beneath the SC. No void was found at the third core location.

The RCP exiting the manhole structure was examined with CCTV techniques that night. Nothing unusual was observed in the outgoing RCP.

2014-01_technical-paper_prague-19

Figure 19: Core, 46 cm (18 inches) long, lying on its side at bottom of void beneath the PCC.

Four additional cores were obtained in December 2011 to further delineate the lateral extent of the void. These were located approximately 7.6 m (25 feet) away from the manhole and they encountered no voids or distress. Based on the results of the cores and soil test borings and the fact that an abandoned CMP drain line exhibited an apparent soil blockage very near the manhole structure, it was assumed that the void beneath the PCC was likely due to a loss of subgrade soil into the abandoned CMP drain line.

5.3 Taxiway D and L Preliminary Repair Plan

Sometimes the engineering investigation does not provide a conclusive answer or operational constraints may dictate that repair plans be developed as you move forward. Since the engineering investigation provided a likely but not completely conclusive cause of the distress it was decided to develop and implement a preliminary design and repair which would include further investigation and confirmation of the cause. Therefore, the preliminary design repair was determined to consist of demolition and removal of the existing PCC, CTB, and SC in the 6 slabs plus the heavily reinforced utility slab. The subgrade soil was to then be excavated to a depth sufficient to expose the abandoned CMP drain line. The excavation revealed that the top of the CMP was near the top of one of the RCPs and very near to it. It also indicated that the CMP was approximately 1.5 m (5 feet) long and had not been properly plugged previously. Soil was being lost into the CMP and likely washed away in the pipe that exited the manhole.

Figure 20 shows the void beneath the SC and CTB. The PCC has been removed from the top of the CTB. Figure 21 shows the CMP drain line and the void where soil was being lost into an opening in the CMP that had not been properly plugged.

2014-01_technical-paper_prague-20

Figure 20: View of void beneath SC and CTB observed during the demolition in the preliminary repair procedures (PCC has been removed).

2014-01_technical-paper_prague-21

Figure 21: Void and loss of soil in opening in improperly plugged abandoned CMP drain line.

5.4 Taxiway D and L Final Repair and Implementation

Based on the results of the preliminary repair plan and excavation, the final repair consisted of properly plugging the hole in the manhole structure where the CMP entered. The outside of the plug was filled with the placement of approximately 76 cm (30 inches) of flowable cementitious backfill (FCB). The FCB was specified to achieve a compressive strength of 1380 kPa (200 psi) at 28 days. The mix used exhibited a compressive strength of 2620 kPa (380 psi) at 7 days because the area could not be closed for 28 days. Figure 22 shows the placement of the FCB in the excavation. The FCB was covered with compacted M-10 sand to within 72 cm (29 inches) of the top of the surrounding pavement that was to be left in place.
The M-10 sand was compacted to 95% of modified Proctor dry density. Figure 23 shows the placement of the M-10 sand.

A layer consisting of 23 cm (9 inches) of low slump, low strength cementitious base was placed over the top of the compacted M-10 sand. High early strength PCC, 51 cm (20 inches) thick was then placed manually over the base. The mix was expected to achieve a flexural strength of 4480 kPa (650 psi) in third point loading in 2 days. The mix used achieved 4860 kPa (705 psi) in 24 hours. The overall repair also had provisions for the repair of a 20 cm (8 inch) diameter underdrain that traversed the repair area. Figure 24 shows the repair area ready to receive the PCC. Figure 25 shows the completed PCC pavement.

The repair was executed in 16 days starting on March 19, 2012. The repair is currently 2 years old and serving well.

2014-01_technical-paper_prague-22

Figure 22: Placement of FCB around the plug in the manhole structure where the CMP entered the manhole.

2014-01_technical-paper_prague-23

Figure 23: Compaction of M-10 sand above the flowable fill.

2014-01_technical-paper_prague-24

Figure 24: Repair area ready for placement of PCC.

2014-01_technical-paper_prague-25

Figure 25: View of completed PCC pavement.

REFERENCES

Greer, W. C., Kuchikulla, S. R., and Drinkard, J. L., 2012. Pavement Management: Key to Sustainable Concrete Pavement at the World’s Busiest Airport. 10th International Conference on Concrete Pavements, Quebec City, Canada.

Greer, W. C., Kuchikulla, S. R., Masters, K., and Rone, J., 2013. Design, Construction, and Maintenance of Concrete Pavements at the World’s Busiest Airport. 9th International Conference on the Bearing Capacity of Roads, Railroads, and Airfields, Trondheim, Norway.

CONTINUE READING

2013-01_technical-paper_Norway-1.jpg

Design, Construction and Maintenance of Concrete Pavements at the World’s Busiest Airport

January 1, 2013Technical Paper

Download PDF


W. Charles Greer, Jr., P.E.
AMEC Environment & Infrastructure, Inc., Alpharetta, GA, USA

Subash Reddy Kuchikulla
Materials Managers and Engineers, Inc., Atlanta, GA, USA

Kathryn Masters, P.E.
Hartsfield-Jackson Atlanta International Airport, Atlanta, GA, USA

John Rone, P.E.
Hartsfield-Jackson Atlanta International Airport, Atlanta, GA, USA

ABSTRACT

In 2011, Hartsfield-Jackson Atlanta International Airport (ATL) served more than 92 million passengers and experienced more than 923,000 aircraft operations. As the busiest airport in the world, its two main departure runways serve more than 200,000 departures per year. This paper presents the design, construction and maintenance procedures used at ATL over the last 40 years that have allowed economical, efficient, and timely service by the concrete runway, taxiway and apron pavements. The two departure runways have served almost double their original design lives with each serving more than 5 million departures. One of the runways (RW-8R) was replaced in 2006 at an age of 37 years. The other runway (RW-9L) continues to serve and is 38 years old. It is projected to serve several more years. Innovations in joint design including the elimination of keyways, concrete slabs dowelled on all four sides and slab geometry on taxiways to improve load placement of gears of heavy jets to reduce stresses and the attendant longitudinal joint cracking are discussed. Evaluation techniques for alkali-silica (ASR) distress and design improvements to reduce the impact of ASR are presented. The use of subsurface underdrain features have contributed to the extended life and excellent performance of the pavements. In addition, Pavement Management System techniques used to evaluate, maintain and extend the life of the two main departure runways to nearly double their original design lives are presented. The overall savings experienced by ATL just in capital costs for replacement of the two runways has been conservatively estimated to be more the 100 million dollars (US).

KEY WORDS: Concrete, pavement, design, evaluation, maintenance.

1 INTRODUCTION

Hartsfield-Jackson Atlanta International Airport (ATL) is the busiest airport in the world. Aircraft traffic ranges from small regional jets to large wide-bodied aircraft including the A- 380. Annual operations have grown from 500,000 in the 1970’s to 923,000 in 2011. Long life pavements with reliable performance are crucial to the economical, efficient and timely operation of the airport. Concrete pavements for ATL have been key to reliable performance for more than 40 years. Over this time frame, there have been numerous changes and advances in the design, evaluation, and maintenance of the airfield pavements at ATL. These have included the use of innovation in joint design with the elimination of keyways, concrete slabs dowelled on all four sides and slab geometry to improve placement of aircraft gear loads to reduce stresses and the attendant longitudinal joint cracking. The use of subsurface underdrains has shown to be very beneficial for reliable and extended good pavement performance. Alkali-silica reactivity (ASR) has also been identified, monitored and treated to extend the life of the pavements, both existing and new. One of the world’s most comprehensive airfield Pavement Management Systems with its genesis in 1984 has been developed and utilized to help provide reliable long life performance of the concrete pavements at ATL through improved analysis of the needs for repair versus replacement.

2 DESIGN, MAINTENANCE AND CONSTRUCTION ISSUES

Typical pavement sections have been 16 inches of concrete (650-psi flexural strength in thirdpoint loading) over 6 inches of cement treated base course (750 psi compressive strength at 7 days) over 6 inches of soil-cement (400 psi compressive strength at 7 days) over silty subgrade soil with typical k-values in the 100-150 pci range. Recent sections have been modified to 18-20 inches of concrete over 9 inches of soil-cement (600 psi compressive strength at 7 days) over soil subgrade. The design, construction, and maintenance issues for concrete pavement that have been utilized at ATL are discussed in the following sections.

2.1 Slab Size

One of the most important changes at ATL over the years has been the improvements made in slab size for the concrete pavement. In the 1960’s and early 1970’s the runways and taxiways were designed with concrete slabs that were generally 25 feet wide by 75 feet long. Temperature steel was typically placed in slabs to help control shrinkage cracking. Preplaced dowel baskets were used to place dowels across transverse joints prior to placement of concrete with slip-form pavers. Transverse joints were sawed shortly after placement of concrete. However, transverse cracks often eventually occurred at third-points of slabs, thereby yielding “slabs” that were approximately 25 feet by 25 feet. Temperature steel held shrinkage cracks together and significantly reduced deterioration rates at transverse cracks.

RW-8R, the main departure runway on the north side of the airport, was reconstructed in 1969 in 40 days and nights while the airport operated with one main runway. The runway was constructed with 75-foot long slabs with resultant cracks at many third-points of the slabs. RW-9L, the main departure runway on the south side of the airport was replaced in 1974. The slabs were also 75 feet long. Transverse cracks also appeared at the third-points of some of the slabs. Temperature steel mesh held cracks together and significant deterioration at transverse cracks has not been observed. This tendency of the slabs to “square up” resulted in a decision to use slabs that were 25 feet wide by 50 feet long for runways. This configuration was utilized for a new runway, RW-8L, constructed in 1984. Some mid-slab cracking has occurred in slabs. Temperature steel mesh has held the cracks tightly together.

During the 1970’s, taxiway and apron pavements were constructed with slabs that were 25 feet wide by 25 feet long (25×25). These slabs typically exhibited very little, if any, mid-slab cracking. The good performance of the slabs led to a decision by ATL in the 1990’s to use the 25×25 configuration for runways. Three runways (RW-9R, RW-10-28, and RW-8R) have been constructed with this configuration since the late 1990’s and all are performing well at ages of 5 to 13 years.

The 25×25 configuration is counter to the current Federal Aviation Administration (FAA) guidelines that recommend maximum joint spacing of 17.5 feet to 20 feet for concrete pavements in the thickness range for air carrier airports (FAA, 2009). However, the 16- to 20- inch thick concrete pavements with the 25×25 configuration have performed very well at ATL for more than 30 years. Similar performance has been observed at other major airports.

2.2 Longitudinal Joint Design

Through the years, changes in longitudinal joint design yielded significant improvements at ATL. In the 1960’s and early 1970’s, the taxiways at ATL were generally 100 feet wide, thereby making the taxiways 4 slabs wide (slabs 25 feet wide by 50 feet or 75 feet long). In the 1970’s, a design change was necessitated by FAA criteria. The FAA would not participate in funding taxiways that were more than 75 feet wide. Thus, taxiway widths were reduced to 75 feet. This resulted in taxiway designs that were 3 slabs wide (slabs 25 feet wide). Longitudinal joints for the 4 slab and 3 slab configurations for the taxiways were keyways with deformed steel tie bars. Longitudinal joints for runways were also keyways with deformed steel tie bars.

The change in width from 100 feet to 75 feet for taxiways moved main gear loading from central portions of the slabs to near longitudinal joints as shown in Figure 1. Increased stress due to frequent heavy loads, particularly B-727 and wide body aircraft, at or close to longitudinal keyway joints led to numerous premature failures of longitudinal joints on taxiways in the early 1980’s. The taxiway pavements were only a few years old. Investigations of the failures indicated, that in some cases, malformed keyways also contributed to some failures along with high stresses at the joints. Failure was typically cracking of the top of the female side of the joint with ultimate loss of the cracked concrete portion. Figure 2 shows an example of a typical failure of the keyway on a taxiway for the 75-foot wide configuration. A section cut through the pavement transverse to the longitudinal joint is also shown in Figure 2. It shows the failure of the top of the female side of the keyway and a slight malformation of the keyway relative to the design.

2013-01_technical-paper_norway-1

Figure 1: Difference in gear placement for 75-foot versus 100-foot wide taxiways.

Procedures for repair of keyway failures and other type of spalls along the longitudinal joints were developed by engineers for ATL. Repair consisted of sawing off the male portion of the keyway. The cracked side of the female portion of the keyway was removed by sawing down to the bottom of the female portion of the keyway outside the cracked area and “squaring” the removed area as shown in Figure 3. Spacer material was placed along the area where the male portion of the keyway was removed in order to maintain the longitudinal joint after the repair was completed. Angled deformed steel reinforcing bars were installed with epoxy in holes drilled into the concrete on the female side of the joint as shown in Figure 3. The surface of the in-place concrete in the removal area on the female portion of the joint was coated with a bonding agent such as epoxy. Concrete with steel fibers was then placed in the removal area to re-establish the concrete. The steel reinforcing bars held the repair in place if the bonding agent did not hold, and the steel fibers held the repair together if it cracked.

2013-01_technical-paper_norway-2

Figure 2: Failure of longitudinal joint with keyway on 75-foot wide taxiway.

2013-01_technical-paper_norway-3

Figure 3: Failure of longitudinal keyway joint on female side of joint (top) and special long-term “block” type repair (bottom).

The repair procedure shown in Figure 3 has served very well at ATL for almost 30 years. Figure 4 shows a repair in 1990 that was made during the 1980’s and the condition of the same repair in 2004, 14 years later. This clearly has been a very durable repair procedure.

As a result of these premature keyway failures, the design of longitudinal joints was changed from tied keyways to butt type joints in the mid 1980’s. The longitudinal joints were also heavily doweled similar to transverse joints. This was applied to runway and taxiway pavements. There was concern at the time that the dowelling on all four sides might result in “lock up” of the slabs that would result in mid-slab shrinkage cracking. This has not been observed in the almost 30 years that the all around dowel procedure has been used. Similar good performance has been observed by the authors at other major airports.

2013-01_technical-paper_norway-4

Figure 4: Special steel fiber concrete block type repair of longitudinal keyway joint as seen in 1990 and again in 2004 (Rubber removal operations have impacted coloration).

2.3 Joint and Slab Layout

In addition to the change to slabs doweled on all four sides and the use of butt type longitudinal joints, ATL designers also changed the geometry of the joint and slab layout on 75-foot wide taxiways in the late 1980’s to four slabs wide instead of three. The width of the center two slabs was 25 feet and the outer slab on either side was 12.5 feet wide. This is shown in Figure 5. It should be noted that the 4-slab configuration results in the main gears of large commercial aircraft generally in the central portion of the slabs away from the longitudinal joints while the 3-slab configuration results in the main gears in close proximity to the longitudinal joint. The 4-slab configuration has served very well since the late 1980’s at ATL. This configuration has also been adopted at other air carrier airports with heavy traffic.

2013-01_technical-paper_norway-5

Figure 5: General range of centerline of main gear on commercial aircraft for both narrow and wide gears for the 3-slab and 4-slab configurations for 75-foot wide taxiways.

In 1987 there were some corner breaks in one short section of a major departure taxiway that was constructed in the late 1970’s with the 3-slab configuration. It was determined that the slabs had curled and the transverse joints exhibited faulting despite being heavily doweled. The concrete pavement was approximately 7 years old and the traffic was primarily loaded outbound aircraft with main gear loads tracking the keyway longitudinal joints due to the 3-slab configuration. During the investigation of the problem, one slab exhibited deflection at the corner under the main gear of a DC-8 aircraft but the slab had not yet cracked. The deflection was visually observable from a distance of approximately 25 feet.

The outer 2 lanes of slabs of the distressed portion of the taxiway were sawed longitudinally at the transverse mid-point. The interior 50 feet of taxiway concrete was removed and replaced with 2 lanes of slabs that were each 25 feet wide similar to the 4-slab configuration shown in Figure 5. This geometry placed the main gears of the large aircraft in the longitudinal central portions of the slabs. The outer 12.5 feet wide lanes of original slabs were left in-place. The longitudinal butt joint configuration with heavy dowels was used for the replacement. The taxiway continues to perform well at an age of 25 years with a Pavement Condition Index (PCI) in the fair to good range.

This repair scenario along with the results of other various investigations, observations, and evaluations of joint performance for taxiways led to a major change in the design philosophy for taxiways for ATL. Concrete taxiways that are 75 feet wide have been designed with the 4-slab configuration shown in Figure 5. This does increase the initial cost as an additional lane of pavement has to be placed and there is an additional longitudinal joint, but the improved performance and life of the pavements far outweighs the additional costs.

2.4 Moderate Flexural Strength Requirement for the Concrete

Another key design parameter for the concrete pavement at ATL has been the specification of a moderate flexural strength for the concrete pavement. There is sometimes a tendency among designers to specify a high level of flexural strength in order to reduce the thickness of the pavement. However, this can have a detrimental effect in that more cement is required to reach the higher strength requirements and this can result in higher shrinkage of the in-place concrete slabs and increase the potential for cracking. The thinner slabs can also be more prone to curling and cracking as there is less weight to hold them in contact with the base support when they try to curl due to shrinkage or temperature differentials.

ATL has typically specified a flexural strength in third-point loading of 650 pounds per square inch (psi) at 28 days. There have traditionally been very few instances of problems achieving this strength requirement and the performance of the pavements over the last 40 years indicates that concrete pavements with this level of specified flexural strength have performed very well.

2.5 Use of Underdrains

Underdrains in the subgrade have been used at ATL for more than 40 years. The drains typically consist of trenches 18-inches wide by 48-inches deep from the top of pavement. A perforated plastic pipe (6-inch diameter) is placed in the bottom of the trench. The trench is backfilled with an open-graded pea-gravel sized crushed stone, such as Number 89 as specified by ASTM International (ASTM) C-33 or the American Association of State Highway and Transportation Officials (AASHTO). The trench typically extends through the top of the subgrade and soil-cement as shown in Figure 6. The plan layout pattern is herringbone in nature as shown in Figure 7 with trenches alternating either side of the centerline and extending from the centerline to the shoulder. At the shoulder the drains are connected to longitudinal collectors tied to the underground drainage system.

The underdrains are used in fill as well as cut areas. Experience at ATL has shown that underdrains are required in fill sections as well as cut sections. There have been several instances where structural failures of concrete pavement have occurred in small areas due to wet subgrade conditions at the top and edge of deep fills. Many times a plugged underdrain has been found at these locations. Thus a significant amount of water moves through the pavement system even when the joints are sealed and there is reasonable surface drainage.

2013-01_technical-paper_norway-6

Figure 6: Schematic of underdrain for ATL – vertical section.

2013-01_technical-paper_norway-7

Figure 7: Plan view of underdrain layout for ATL.

2.6 Alkali-Silica Reactivity Issues

Alkali-silica reactivity (ASR) was first observed at ATL in 1984 in the concrete pavement for RW-8R (1969) and RW-9L (1974) during an evaluation of potential replacement of RW-8R. Petrographic examinations of cores of the concrete were performed and some ASR was noted. The ASR was typically minor with little or no disruption of the paste to aggregate bond. ASR was monitored on a qualitative basis for several years in each round of a Pavement Management System (PMS) that started with the 1984 evaluation of RW-8R. ASR was also first observed in 1990 in RW-9R, a primary landing runway south of RW-9L. The 1997 PMS program recommended replacement of this runway in 1999 at an age of 27 years. The runway was reconstructed in 5 weeks in 1999.

During the 1970’s through the mid 1990’s low alkali cement was not required for concrete pavement at ATL. However, a review of mill test reports for cement used in the reconstruction of RW-9L (1974) indicated that the cement would meet the requirements for low alkali cement even though it was not specified. The ASR in RW-9L has remained in the low to moderate severity category in the opinion of the authors.

RW-8L was constructed in 1984. The concrete used slag cement and ASR issues appear to be low. The use of slag cement appears to have been beneficial from the standpoint of ASR. The runway is 28 years old and scheduled for keel section replacement in the near future, but the replacement is for reasons other than ASR.

Once the observation of ASR at ATL became prevalent in the 1990’s, the specifications were revised to require the use of low alkali cement. Currently, aggregates are tested and lithium is required if the aggregates indicate susceptibility to ASR. Some surficial treatments with lithium on existing concrete have been performed. These are still being observed to determine the extent of the benefit.

2.7 Proper Materials Testing During Construction

Proper materials testing during construction has been crucial for the long life pavement performance at ATL. The materials testing specifications for concrete for the reconstruction of RW-9L in 1974 required that the concrete flexural test specimens be cured at controlled temperatures of 600 to 800 F during the first 24 hours after preparation. However, provisions for this were not made, and the beams were cured during the first 24 hours “out on the pavement” in the heat of summer. The temperature environment during the day was often in excess of 900 F. The temperature of the concrete at the time of sampling was often times greater than 900 F.

Approximately 50 percent of the flexural test beams failed to achieve the nominal design flexural strength of 650 psi at 28 days. Almost all of the beams which had concrete temperatures at the time of sampling of 900 F or greater failed to achieve the nominal design flexural strength. RW-9L is still serving as a primary departure runway including the long haul heavily loaded international flights to the Pacific Rim. Structural capacity based on falling weight deflectometer (FWD) and heavy weight deflectometer (HWD) testing in the PMS program is still very good. The specifications for all subsequent projects at ATL have required stringent adherence to proper testing procedures.

Clearly material testing does not determine the performance of concrete pavement as placed. However, proper testing is crucial for proper evaluation of concrete design, construction and maintenance requirements. If test results indicate that flexural strength is low, the contractor will increase the cement to increase the strength and reduce payment penalties. The addition of cement, particularly when not necessary, may lead to increased shrinkage and cracking. Specifications may require the replacement of cracked slabs. Proper testing allows for better quality control and better quality control allows the contractor to utilize a lesser amount of material such as cement. This will reduce the propensity for shrinkage and associated cracking along with costs.

The material test results during construction have served to confirm that the pavement is constructed as designed, and it provided a valuable baseline for comparison of later in-place tests as the pavements age. These have been very beneficial for the evaluation of proper requirements and specifications during the construction phases on the projects as well as during the evaluation of long-term performance and operational life of the pavements at ATL. They have also reduced the cost of construction as contractors have confidence in the test results and can operate with greater efficiency and economy.

3 PAVEMENT MANAGEMENT SYSTEM

One of the most useful tools for long life concrete pavements at ATL has been the Pavement Management System (PMS) program that was initiated with the 1984 evaluation of RW-8R. The PMS has evolved into one of the most comprehensive airfield PMS programs in the world. It has been instrumental in documenting the long-term performance of the concrete pavements at ATL and information from it has been used to extend the life of the concrete pavements, specifically the two main departure runways, RW-8R and RW-9L, to almost double their original design lives.

In 1984 ATL management personnel were ready to replace RW-8R. It exhibited significant cracks in the surface of the concrete pavement and longitudinal keyway joints were cracked. The runway had served 20 years of traffic in its 15 years of existence. A new additional runway, RW-8L, had just been completed and ATL management felt that maybe RW-8R should be replaced before users became accustomed to having 4 runways. ATL personnel agreed to perform an evaluation to assess the need for repair versus replacement. The evaluation consisted FWD testing, cores and borings of the pavement system layers, laboratory testing of these layers, including petrographic testing to better define the conditions of the in-place concrete pavement, and analysis of the remaining service life.

It was determined from the evaluation that the cracks in the surface of the concrete only went 3 to 5 inches below the surface and stopped. Petrographic analysis of cores of the concrete indicated that they were most likely early age shrinkage cracks. The FWD data indicated good structural capacity for the pavement system. Thus it was recommended that ATL replace 10-15 slabs (only portions of 2 slabs out of 800 had to actually be replaced), seal cracks greater than ¼ inch wide with a flexible sealant, repair the longitudinal joint cracks, and re-seal all joints. It was also recommended that the evaluation be repeated in 3 years to confirm that performance was as expected and to begin the establishment of performance history curves.

The 1984 evaluation was repeated was repeated in 1987, 1990, 1994, 1997, 2001, 2004, 2007 and 2010. RW-8R remained in service until 2006 when it was replaced at an age of 37 years. It is estimated that it served more than 5 million departures. Over the years, new technologies have been added to the program to improve the analyses and better define the actions required to maintain the concrete pavements in an acceptable condition. Table 1 presents a list of the various technologies that have been used and when they were introduced. The techniques have included profile determination with a laser profilometer and roughness simulation, high speed digital video imaging to record the condition of the entire pavement surface of the runways, as well as a detailed photographic library of conditions at key locations over many years. Figure 4 is an example from this photographic library. The ability to look at conditions over many years has allowed better evaluation of distress and its progression or lack of progression with time. This has saved ATL from making decisions to replace pavement that can continue to serve well for many years. The techniques for the PMS are discussed in detail in another paper (Greer, Drinkard, and Kuchikulla, 2009).

4 SUMMARY

Over the last 40 years, numerous improvements have been made to the design, construction and maintenance procedures for the concrete pavements at ATL. These procedures have greatly extended the life of the pavements as exhibited by the almost 40 years of service from the two main departure runways and the excellent performance of pavements that have been constructed since they were built. The innovations at ATL have also been used by other airports with similar good performance.

The innovations and the PMS program at ATL have allowed ATL to save more than $100 million (US) in capital replacement costs by extending the life of the 2 departure runways to nearly double their original 20 year design lives. There have also been extensive savings in reduced delays to the airlines, fewer resources used for construction and less pollution from construction equipment as a result of construction that could be delayed or skipped.

Table 1 – Summary of techniques utilized for ATL PMS program and year introduced.

Technique 1984 1987 1990 1994 1997 2001 2004 2007 2010
Visual Surveys1 X X X X X X X X X
Automated Video2 X X X
Crack Surveys3 X X X X X
FWD4 X X X X X
HWD5 X X X X
RDD6 X
Ride Quality7 X X X X X X
Cores/Borings8 X X X X X X X X
Laboratory Tests9 X X X X X X X X
Concrete Studies10 X X X X X X X X
SEM/EDX11 X X X
Photo History12 X X X X X X X X X
MicroPaver X X X X
GIS X X X X

1 – Pavement Condition Index (PCI) procedures were formally instituted in 1990.
2 – Automated Digital Video Mapping with High-Speed Imagery.
3 – Crack surveys with location and conditions tied to database and GIS.
4 – Falling weight deflectometer, approximately 25,000 pound capacity.
5 – Heavy weight deflectometer, approximately 60,000 pound capacity.
6 – Rolling dynamic deflectometer.
7 – Profile measured and analyzed to locate excessive rough areas.
8 – Cores of pavement along with soil borings and undisturbed samples of subgrade.
9 – Strength tests of cores and soil subgrade.
10 – Petrographic examinations of concrete cores.
11 – Scanning electron microscopy and energy dispersive x-ray analyses.
12 – Cameras with GIS capability were introduced in 2010.Deterioration from ASR

REFERENCES

FAA, 2009. Airport Pavement Design and Evaluation. Advisory Circular 150/5320-6E, U. S. Department of Transportation, Federal Aviation Administration, Washington, D.C.

Greer, W. C., Drinkard, J. L., and Kuchikulla, S. R., 2012. Pavement Management: Key to Sustainable Concrete Pavement at the World’s Busiest Airport. 10th International Conference on Concrete Pavements, Quebec City, Quebec, Canada.

The authors thank Myrna White of ATL for her thorough review and very helpful comments.

CONTINUE READING

2012-01_technical-paper-2.jpg

Pavement Management: Key to Sustainable Concrete Pavement at the World’s Busiest Airport

January 1, 2012Technical Paper

Download PDF


W. Charles Greer, Jr.
P.E. Senior Vice President, AMEC E&I, Alpharetta, GA

Subash Reddy Kuchikulla

President, Materials Managers and Engineers, Inc., Atlanta, GA

Jim Drinkard
Assistant General Manager, Hartsfield-Jackson ATL Airport, Atlanta, GA

Abstract

The Hartsfield-Jackson Atlanta International Airport (ATL) is the busiest airport in the world in terms of passengers and aircraft operations. In 2010, it served more than 89 million passengers with 950,119 aircraft operations. Reliable performance with little down time for its airfield pavements is critical to providing efficient, safe, and economical travel. Concrete pavements have long been the keystone of this capability at ATL. This paper presents the design, construction, maintenance, and evaluation procedures and activities that comprise the Pavement Management System (PMS) used at ATL to provide sustainable concrete pavements. The sustainability issues include long life pavements that have impacts far beyond those of the concrete pavement itself and the airport. Sustainable concrete pavements result in reduced down time, fewer construction delays, less fuel used waiting for takeoff, and fewer materials consumed as a result of the reduced frequency of construction/reconstruction and maintenance. These results help reduce the overall carbon footprint of the airport and its impact on the carbon footprint of other airports and aircraft operations throughout the worldwide air travel system.

Introduction

The northern departure runway (RW-8R) was reconstructed in 1969 in 40 days and 40 nights while the airport operated with one main runway. Hence, it was termed “The 40- Day Wonder”. RW-8R was replaced in 2006 at an age of 37 years, well beyond its original 20-year design life.

The southern departure runway (RW-9L) was reconstructed in 1974 in about 6 months. RW-9L was extended in 1985 by 1800 feet on the west end and 2100 feet on the east end. The 8000 feet that was reconstructed in 1974 is still in service at an age of 37 years, also well beyond its 20 year design life. The extensions still serve aircraft today. Both runways are estimated to have served more than 5 million departures each and are a testament to the fact that concrete pavement is and will continue to be very sustainable.

In 1984, RW-8R was thought to be near the end of its serviceable life (John Culpepper, personal discussions, 1984). Thus, ATL initiated a program of pavement evaluation that has evolved into a very comprehensive Pavement Management System (PMS). This program and its feedback to the design, construction, maintenance, and evaluation processes have allowed ATL to significantly extend the life of its 2 main departure runways (RW-8R and RW-9L). The PMS has saved ATL more than $100 million in replacement costs and has made positive impacts for sustainability for these runways as well as for other pavements that have been or will be constructed at ATL. These impacts include reduced use of construction materials and less wasted fuel from aircraft delays 2 due to construction interference. Nearly one whole generation of pavement replacement has been skipped. The reduced delays have an impact that extends far beyond ATL as issues at ATL affect the worldwide air travel system.

Pavement Management System – General

The PMS is the key to long life sustainable concrete pavements at ATL. The program started in 1984 and has evolved into a very comprehensive PMS. In its 27 years, it has provided ATL technical personnel and its consultants with the ability to objectively analyze and evaluate the concrete pavements. It has removed much of the subjective evaluation that is often associated with pavement evaluation and has been fundamental to decisions that have significantly extended the life of concrete pavements at ATL.

The PMS program has utilized new techniques over the last 27 years. These include falling weight deflectometer (FWD) testing, coring, soil boring, split-spoon and undisturbed soil sampling, alkali-silica reactivity (ASR) evaluations, profile measurements and roughness determinations, and high speed digital imaging of the pavement surface conditions. The techniques also include specialized laboratory testing including resilient modulus testing of undisturbed soil samples; elastic modulus determinations on concrete cores as well as cement treated base and soil-cement cores; compressive strength testing of concrete cores, cement treated base and soil-cement cores; split tensile strength testing of concrete cores; scanning electron microscope (SEM) procedures; and energy dispersive x-ray (XRD) analysis.

The results of these evaluations along with improved procedures for design, construction, and maintenance have resulted in very long life concrete pavements for the World’s Busiest Airport. It should be remembered that RW-8R was considered to be at the end of its serviceable life when the PMS evaluations were started in 1984. It served another 22 years and could have gone a little longer had it not been replaced due to operational issues that would occur elsewhere on the airport if the reconstruction were delayed.

Pavement Management System – 1984 Pavement Evaluation

In 1984 the fourth runway (RW-8L) for ATL had just been completed. RW-8R was 15 years into its 20-year design life and thought to be near the end of its useful life. It had served its original 20 years of traffic in 15 years and exhibited significant surface cracking along with cracking of some of the longitudinal keyway joints. Management personnel at the airport were ready to replace it. However, they decided to embark on a program of specialized testing and evaluation to determine if RW-8R should be replaced.

The initial evaluation in the summer of 1984 encompassed the 4 runways and a few key taxiways. The testing utilized the falling weight deflectometer (FWD); coring of the concrete, cement treated base course, and soil-cement subbase; strength testing of these cores; and hand auger soil borings with dynamic cone penetrometer testing of the subgrade to depths of 4 to 8 feet along with undisturbed soil sampling. Petrographic examinations were performed on concrete cores not subjected to strength testing.

The data were analyzed to develop recommendations for RW-8R. The data for the other pavements were utilized in the overall analysis, but no recommendations were developed for pavements other than RW-8R. All data were archived for future evaluations. The FWD data at maximum loads of approximately 25,000 pounds indicated good structural capacity for RW-8R with center-of-slab stiffness values in the range of 5,000 kips/inch. The other 3 runways exhibited center-of-slab stiffness values in the range of 6,000 to 7,000 kips/inch. The basic thickness design of RW-8R was 16 inches of concrete over 6 inches of unbound granular base course over 6 inches of soil-cement on prepared subgrade. The other three runways were similar except 6 inches of cement treated base course was used in place of the 6 inches of granular base. Joint efficiencies for all of the runways were in the range of 85 to 92 percent.

The reasonably good FWD data for RW-8R were counter to the observed cracking in the surface of the concrete. However, the petrographic analysis of the concrete cores indicated that the cracks extended to depths of 3 to 5 inches below the surface of the pavement and stopped. The cracks were also generally very tight. They were attributed to early age drying shrinkage. Thus, the structural capacity of the pavement was assessed to be much better than indicated by the visual condition of the surface. Low severity alkali-silica reactivity (ASR) was observed in some of the cores during the petrographic examinations. It was recommended that this condition be monitored.

It was concluded that RW-8R could serve 5 more years if nominal repairs were made. The recommended repairs involved replacing 10-15 slabs (portions of only 2 slabs were actually replaced), sealing cracks with widths greater than ¼ inch with a flexible sealant, and repair of cracked longitudinal keyway joints with a block type repair that had been developed earlier at ATL specifically for failed keyway joints, and re-sealing of all joints. It was recommended that testing and evaluation be performed again in 3 years to assess the continued performance of all of the pavements and whether RW-8R would serve the full 5 years. The testing in 3 years would allow development and documentation of performance history curves.

Pavement Management System Development and Evolution

The program was repeated in 1987, 1990, 1994, 1997, 2001, 2004, 2007 and 2010. The evaluations resulted in RW-8R serving until 2006 when it was replaced at an age of 37 years so that the reconstruction would best fit the overall construction program and operational requirements of the airport. The program has been the basis for the continued life of RW-9L, the interior 8,000 feet of which is now 37 years old. The program identified ASR issues in RW-9R in 1990. RW-9R was replaced in 5 weeks in 1999. The PMS program was instrumental in providing objective data upon which to base the final decision to replace the runway when it was 27 years old, significantly beyond its original 20-year design life. During the 27 years of the PMS program numerous new techniques have been added to improve the evaluation process. These are summarized in Table 1.

Table 1 – Summary of Techniques Utilized for ATL PMS Program and Year Introduced.

Technique 1984 1987 1990 1994 1997 2001 2004 2007 2010
Visual Surveys1 X X X X X X X X X
Automated Video2 X X X
Crack Surveys3 X X X X X
FWD4 X X X X X
HWD5 X X X X
RDD6 X
Ride Quality7 X X X X X X
Cores/Borings8 X X X X X X X X
Laboratory Tests9 X X X X X X X X
Concrete Studies10 X X X X X X X X
SEM/EDX11 X X X
Photo History12 X X X X X X X X X
MicroPaver X X X X
GIS X X X X

1 – Pavement Condition Index (PCI) procedures were formally instituted in 1990.
2 – Automated Digital Video Mapping with High-Speed Imagery.
3 – Crack surveys with location and conditions tied to database and GIS.
4 – Falling weight deflectometer, approximately 25,000 pound capacity.
5 – Heavy weight deflectometer, approximately 60,000 pound capacity.
6 – Rolling dynamic deflectometer.
7 – Profile measured and analyzed to locate excessive rough areas.
8 – Cores of pavement along with soil borings and undisturbed samples of subgrade.
9 – Strength tests of cores and soil subgrade.
10 – Petrographic examinations of concrete cores.
11 – Scanning electron microscopy and energy dispersive x-ray analyses.
12 – Cameras with GIS capability were introduced in 2010.Deterioration from ASR

The key to successful utilization of the PMS at ATL to provide long life sustainable concrete pavements has been the introduction of new techniques as they become available and the balanced application of these techniques. Any one technique by itself may lead to conclusions that are counter to conclusions from other techniques. In 1984 the subjective visual condition of RW-8R and its traffic history pointed towards the need for replacement at that time. However, the use of the FWD, material properties determinations, and petrographic examinations of the concrete cores indicated that the runway still had significant useful life.

Visual Surveys: Visual surveys of the pavements by walking were initiated in the 1984 evaluation program. Defects such as cracks, spalls, and joint deterioration were observed and documented. In 1990, the Pavement Condition Index (PCI) procedure was implemented for the runways and extended to the taxiways in 1994. The PCI process has 5 been very useful in allowing objective assessments of the pavement conditions to be made along with estimates of when significant repairs, rehabilitation, or replacement should be planned. This objective process has been one of the key elements in determining that the useful service life of the concrete pavements at ATL could be extended well beyond their original design life. MicroPAVER was implemented in 2001 at ATL to allow a more automated approach for analyzing and managing the pavement data and predicting when critical condition indices might be reached. A typical PCI versus time curve is shown in Figure 1. This data indicated that the PCI values for RW- 8R in the 2004 evaluation were approaching the level at which major rehabilitation or reconstruction would be necessary.

2012-01_technical-paper-1

Figure 1 – Actual & Projected PCI vs. Time for RW-8R – 2004 Evaluation

Automated Digital Video Mapping: The use of automated digital video imaging of the pavement surface was initiated in 2001 for RW-8R and RW-9L and extended to all four runways in 2004. It was used again in 2007 for RW-8L, RW-9L, RW-9R, and RW-10 (new 5th Runway completed in 2006). The data were collected at night with a van traveling at 40 to 60 mph with a scan width of 13 to 15 feet. This technology was used to supplement the walking surveys. Some defects observed in the walking surveys cannot be documented in the automated process. The van and equipment are shown in Figure 2. An entire runway can be mapped in 1 to 2 hours at night when operations are low.

2012-01_technical-paper-2

Figure 2 – Automated Digital Video Mapping Van and Recording Equipment

This technology allows the entire pavement surface condition to be documented and compared over several years in order to assess rates of deterioration. Distresses were also quantified using procedures similar to the Pavement Condition Index (PCI) process in MicroPAVER. Figure 3 shows the cracking distress at one location in 2001 and 2004. Figure 4 shows the cracking distress at another location in 2004 and 2007. These photographs indicate that there was very little change in the condition of the cracks over the three-year intervals. It is also evident that a wide range of crack width conditions can be documented with this technique. The authors have found that projecting the images on a large wall at large magnification makes it easier to see the “big picture” as opposed to the feeling that one is “looking at the pavement through a microscope”.

2012-01_technical-paper-3

Figure 3 – Automated Video Mapping Output for a Location in 2001 and 2004

2012-01_technical-paper-4

Figure 4 – Automated Video Mapping Output for a Location in 2004 and 2007

Crack Surveys: In 1995, ATL began conducting detailed inspections intended to quantify cracks, spalls, and patches with ratings of good – fair – poor. The surveys have typically been conducted in the Fall of the year. They consist of a surveyor on foot with a GPS antenna and a steel dowel bar. The dowel bar is used to “sound” patches and joints for hollow sounds that could indicate cracks and delaminations. If a defect is found, the condition is documented as to severity and extent and the location is recorded with the GPS. A typical record of cracking for RW-8L is shown in Figure 5. These data are used to help establish periodic maintenance activities.

2012-01_technical-paper-5

Figure 5 – Crack Survey Map with Detail for RW-8L Based on Database and GPS

Falling Weight Deflectometer Testing: The falling weight deflectometer with a load capacity of 25,000 pounds (FWD) was first used in the 1984 evaluation. The FWD is a device that drops a weight on the pavement surface. The force of the weight is transmitted to the pavement surface through a steel plate with hard rubber pad and spring system. The diameter of the plate is approximately 12 inches. The height and weight can be varied so that a force up to approximately 25,000 pounds is achieved. The deflection of the pavement surface is measured at the center of the load plate and at offsets up to a few feet. The deflection sensors can be set across joints (longitudinal, transverse, and corners) so that joint efficiency for concrete pavements can be measured. In 2001, the Heavy Weight Deflectometer (HWD) was initiated into the PMS in lieu of the FWD in recognition of the increasing weights of current and future aircraft. The HWD can approach forces of 60,000 pounds on a plate with a diameter of approximately 18 inches.

The Rolling Dynamic Deflectometer (RDD) was utilized in 2001 for RW-8R and RW- 9L. Three longitudinal profiles were obtained for each of these 2 runways. The RDD provides a continuous stiffness/deflection data stream. However, it was determined that the HWD provided sufficient and effective data for analysis and evaluation.

Runway Ride Quality Measurement: In 1994, ATL added surface profile measurement and roughness/smoothness analysis for the runways to the program. This was done to determine ride quality which is usually based on “bumps” over longitudinal distances of 50 to 150 feet versus roughness or smoothness which is typically measured over distances of 10 to 15 feet or less. The profile was measured with proprietary equipment that utilizes a laser to radiate a plane of light and a cart system that has light sensitive cells on it (See Figure 6). Once the cart system has locked onto the laser, the cart is pushed along the longitudinal direction of the pavement and the system records the elevation of the cart every foot. The data are analyzed to determine the aircraft responses with proprietary software.

2012-01_technical-paper-6

Figure 6 – Laser Source (left) and Cart System (right) for Profile Measurements

2012-01_technical-paper-7

Figure 7 – Pavement Smoothness Index (PSI) versus Position, RW-8R, 2001 & 2004

The profile analysis output can be expressed as a Pavement Smoothness Index (PSI). Plots of PSI versus longitudinal position for RW-8R for 2001 and 2004 are shown in Figure 7. Changes in PSI with time can be monitored and aid in determining when to repair or replace a pavement due to excessive roughness. A pavement that is structurally very strong and exhibits little or no surface defects may be unacceptably rough. The runways at ATL have typically exhibited good smoothness.

Field Coring, Drilling, and Sampling: Coring of the concrete, cement treated base, and soil cement has been used in every evaluation except 1987. The subgrade soils were tested with standard soil test borings and undisturbed sampling. Test locations were generally located to investigate specific conditions observed in the visual surveys, particularly cracks, or anomalies noted in the FWD/HWD testing. The samples were returned to the laboratory for characterization tests. Occasionally it becomes necessary to do something out of the ordinary such as obtaining a large concrete core (26-inch diameter) in order to evaluate a problem such as corner cracking of concrete slabs on a taxiway. The investigation indicated that the slabs had curled and the corners were under the main gears of the aircraft.

2012-01_technical-paper-8

Figure 8 – Large 26-inch Diameter Core for Taxiway Cracking Investigation

Laboratory Testing: In the laboratory, strength and modulus of elasticity tests were performed on the cores of concrete, cement treated base, and the soil-cement. Split tensile strength tests were also performed on cores of the concrete. The results of these tests over the years have been correlated to quality control and quality acceptance tests performed during construction. The correlations have helped assure that the construction specifications are appropriate and have provided material relationships for evaluations of materials at the time of construction to determine their acceptability. The tests have been performed in every evaluation except 1987. Resilient modulus (Er) tests on the undisturbed samples of the subgrade were first performed during the 1990 evaluation and in every evaluation since (See Figure 9). The Er tests were used for layered elastic analyses of the pavements.

2012-01_technical-paper-9

Figure 9 – Resilient Modulus Test Equipment for Subgrade Soil Characterization

Petrographic Examinations: Cores of concrete not tested for strength were cut and polished to very smooth surfaces. They were examined petrographically with a binocular optical stereo-microscope at 10x-60x. This was done to observe the nature of cracks, assess the presence of reactions between the paste and aggregates, and evaluate secondary deposits in the air voids from ettringite formation. These procedures have been very useful in assessing the extent and severity of ASR issues in the concrete. Micro-photographs were taken of key conditions and observations. Figure 10 shows the microscope and condition in one of the cores with secondary deposits in a crack.

2012-01_technical-paper-10

Figure 10 – Petrographic Examination of Concrete Core with Binocular Microscope

Scanning Electron Microscopy and Energy Dispersive X-ray Analysis: In 2004, analyses of concrete cores with scanning electron microscopy (SEM) and energy dispersive x-ray (EDX) procedures were initiated. The SEM procedures were used to examine the polished surfaces of the concrete to assess the nature of cracks, voids, and reaction rims around the aggregates in the concrete. The EDX procedures were used to assess the chemical make-up of the surface including deposits in the cracks and voids. These analyses also allowed an in-depth assessment of the extent of ASR. Figure 11 shows the SEM/EDX equipment and output.

2012-01_technical-paper-11

Figure 11 – SEM/EDX Equipment and Output for Concrete Core Analysis

Photographic Documentation: In the 1984 evaluation, conditions of the concrete cores in the laboratory analysis were documented with photographs. In 1987, field conditions of the pavement were also documented with photographs, particularly key areas that exhibited distress or unusual patterns of cracking. Over the years photographs were taken at locations in very close proximity to the previous photographs of the pavements. This allowed comparative assessments to be made relative to the extent and rate of deterioration condition of the pavement at these locations.

Figure 12 shows a patch for RW-8R in 1990 and again in 2004. Although the lighting effects and coloration are different in the two photographs, it is clear that the patch has performed very well during the 14-year time frame.

2012-01_technical-paper-12

Figure 12 – Condition of Patch at Slabs 47B/C in RW-8R in 1990 and 2004

2012-01_technical-paper-13

Figure 13 – Condition of Surface Cracking in RW-8R in 1987 and 2004

Figure 13 shows surface cracking in RW-8R in 1987 and again in 2004. Again the lighting and coloration are different, but the cracking and the crack repair did not greatly worsen over the 17 years between the photographs. The photographic history has been invaluable in supplementing the PCI data and the overall evaluation of deterioration rates.

Pavement Management System Summary

The PMS has been the most useful tool for providing sustainable concrete pavement at ATL. Figure 14 presents a composite summary from the 2004 evaluation. This summary allows one to visualize several condition/performance factors at one time. Distress in one parameter can be compared with other parameters for correlation. The extent of poor condition can also be seen. This summary picture can greatly aid in deciding that the life of concrete pavements can be extended. The PMS has also been a great investment for ATL; it has saved more than $100 million in replacement costs over the years by allowing the airport to skip a whole generation of replacement for its 2 main departure runways.

2012-01_technical-paper-14

Figure 14 – Composite summary of the PCI, FWD Center-of-Slab Stiffness, and PSI for RW-8R for 2004 Evaluation

It is the opinion of the authors, that the PMS and the longevity and continuity of the ATL staff and their institutional knowledge have helped provide long life and sustainable pavements at ATL.

Acknowledgements:

The authors personally acknowledge Mr. Frank Hayes who has served at ATL in many capacities since 1974 for his support and contributions to sustainable long life concrete pavements at ATL and the PMS program.

The authors also acknowledge the City of Atlanta Department of Aviation for the support and contributions of its many staff members over the years who have also greatly supported and contributed to the PMS and sustainable concrete pavements at ATL.

CONTINUE READING

2002-01_Reconstruction-of-Runway.jpg

Reconstruction of Runway 9R-27L at Hartsfield Atlanta International Airport. The 33-Day Wonder – a Case History

January 1, 2002Technical Paper

Download PDF


D.S. Saxena
ASC geosciences, inc. USA

S.R. Kuchikulla
R&D Testing & Drilling, Inc. USA

D. Molloy
Hartsfield Atlanta International Airport USA

Frank O. Hayes
Aviation Consulting Engineers, Inc. USA

ABSTRACT. The William B. Hartsfield Atlanta International Airport (ATL) is the world’s busiest airport handling some 80 million passengers annually and serves major international and domestic markets around the globe. The airfield itself consists of roughly 4,200,000 sq m (5,000,000 sq yds) of pavement and includes 4 parallel runways measuring from 2,740 to 3,620 m (9,000 to 11,889 ft) long.

Runway 9R-27L was initially constructed over 27 years ago and has been in service  well beyond its design life. Due to pavement deterioration accelerated by alkali-silica reactivity (ASR) and other distress, the owner decided to remove Runway 9R-27L in late 1999 under a fast-track 36 day schedule. A joint venture of major contractors bid $ 52 million to complete the project under this fast track approach. A conventional approach was estimated to cost between $ 15 and $ 20 million without factoring the impact of a closed runway at some $ 475,000 per day over a normal 6 month construction timeframe.

Keywords: aviation, runways, PCI, ASR, quality control testing, flexural strength

Mr. Anupam Saxena, P.E., M. ASCE, is Technical Services Manager of ASC geosciences, inc., 2260 Godby Road, Atlanta, Georgia, 30349, USA

Mr. D.S. Saxena, P.E., F. ASCE, is Senior Principal and President of ASC geosciences, inc., 3055  Drane Field Road, Lakeland, Florida, 33813, USA

Mr. Subash Reddy Kuchikulla is Quality Assurance Engineer for ATL Geotechnical and Materials Programs at R&D Testing & Drilling, Inc., 2366 Sylvan Road SW, Atlanta, Georgia, 30344, USA

Mr. Daniel Molloy, P.E., is Assistant Aviation General Manager of Facilities at Hartsfield Atlanta International Airport, Department of Aviation, P.O. Box 20509, Atlanta, Georgia, 30320, USA

Mr. Frank O. Hayes is aviation pavement specialist with Aviation Consulting Engineers, Inc., 2400 Aviation Boulevard, Atlanta, Georgia, 30340, USA

BACKGROUND / FUTURE OF ATL 

The William B. Hartsfield Atlanta International Airport (ATL) is the world’s busiest airport handling over 80 million passengers annually and serves major international and domestic markets around the globe. ATL, owned by the City of Atlanta, is located on 1,518 ha (3,750 ac) located some 16 km (10 mi) south of downtown Atlanta. ATL is home to the largest airline hubbing operations in the world, Delta Air Lines, and its Central Passenger Terminal Complex (CPTC) is situated on 53 ha (130 ac) with approximately 529,500 sq m (5.7 million sq ft) of facilities including 6 concourses with 168 gates served by a central, underground airport people mover system and pedestrian mall. Currently, some 34 passenger airlines and 23 all-cargo airlines serve HAIA. The airfield itself consists of roughly 4,200,000 sq m (5,000,000 sq yds) of pavement and includes 4 parallel runways measuring from 2,740 to 3,620 m (9,000 to 11,889 ft) long. These east/west runways handle over 2,000 daily takeoffs and landings.

ATL has begun an intensive Capital Improvements Program totaling some $ 5.4 billion over the next 10 years. This CIP includes 4 major components: 1) a fifth runway; 2) an International Terminal; 3) a Consolidated Rental Car Facility; and, 4) a South Terminal.

ATL AIRFIELDS

History of Runways

In anticipation of considerable growth during the 1970s and 1980s, Runway 8R-26L was reconstructed in 1969 utilizing a 24/7 schedule over 40 days and nights. Construction was expedited in this fashion to reopen the runway as soon as possible. In 1972, 9R-27L was constructed, and in 1974 9L-27R was reconstructed. Runway 8L- 26R was constructed in 1984, with east and west extensions added to 9L-27R.

Throughout the 1980s and well into the 1990s, several pavement evaluation studies were conducted to look more closely at the performance of ATL airfield pavements and address concerns about their structural condition, pavement surface distress, concrete characteristic strengths, and age.

Pavement Evaluation Programs

1997 Pavement Evaluation

An exhaustive pavement evaluation program was performed in 1997 due to concerns about the relative age of some of the runways. The 1997 study employed several investigative techniques, including:

  • Falling Weight Deflectometer (FWD)
  • Visual Survey
  • Runway Ride Quality Measurement
  • Field Delamination Testing including Impact Echo Testing and Ground Penetrating Radar
  • Field Drilling and Sampling
  • Laboratory Testing including Petrographic Examination

Results of the 1997 study indicated the Pavement Condition Index (PCI) of the runways ranged from 53 to 97 with most values in excess of 70. The predominate distress observed was widespread map cracking in each of the runways. In Runway 9R-27L in particular, the joint distress was manifested into localized spall features which were increasing at an accelerating rate, as illustrated in Figure 1. It was noted that while the overall condition of Runway 8R-26L would appear lower than that of Runway 9R-27L, the results of PCI data indicate that 9R-27L was deteriorating at a faster rate than Runway 8R-26L, particularly with respect to the pavement keel or center section. Table 1 summarizes 1997 PCI Data for all ATL runways.

Table 1            Pavement Condition Index for ATL Runways, 1997

Pavement Condition Scale
Excellent 85-100
Very Good 70-84
Good 55-69
Fair 40-54
Poor 25-39
Very Poor 10-24
Failed 0-9
Runway PCI Rating Range of PCI Values Projected Year in Which PCI Becomes Critical (=50)
9R-27L Fair to very good 42 to 80 1999
8R-26L fair to good 42 to 79 2001
9L-27R Good to excellent 57 to 99 2003
8L-26R Very good to excellent 59 to 100 2010-2015

The 1997 pavement evaluation study concluded that a pavement exhibiting a PCI value below 70 would require significant maintenance and one below 50 would require major rehabilitation or replacement.

1 2

Figure 1  Typical Joint Distress

1999 PCI Survey

Amongst growing concerns about the condition of Runway 9R-27L, a pavement evaluation study was again performed utilizing a heavy weight deflectometer (HWD) in lieu of the FWD. Results of the 1999 study indicated PCI values ranging from 25 to 79 with the center or keel portions of the runway again exhibiting significantly lower values.

Section Sample Unit Left (L) Center (C) Right (R)
AB-Line CD-Line EF-Line
01 01 72 72 70
left section 02 76 67 62
03 74 57 61
04 79 46 58
Average 75 61 63
02 05 79 32 74
keel section 06 76 45 74
07 76 50 48
Average 77 42 65
03 08 64 53 63
right section 09 25 44 65
10 53 67 63
11 45 70 61
12 59 71 63
Average 49 61 63

Figure 2 illustrates chronological trends of PCI for center pavement sections of the ATL runways.

3

Deterioration from ASR

During both the 1997 Pavement Evaluation and 1999 PCI Survey, evidence of alkali- silica reactivity (ASR) was observed in concrete cores from all 4 runways, as illustrated in Figure 3. The reactions appeared most severe in Runways 9R-27L and 8R-26L.  Voids in the concrete matrix in these runways appeared nearly filled with the gel  product of ASR. Furthermore, horizontal cracks within the top 15 cm (6 in.) were observed in cores from Runway 9R-27L. The spalling and surface cracks observed in Runway 9R-27L were load-associated and eth distress appeared to have been accelerated as a result of ASR. It was further noted that the ASR appeared worse in concrete pavement using Portland cement and less severe in concrete using slag cement.

Together, these observations in Runway 9R-27L indicated ASR had in fact contributed to the deterioration of the concrete pavement to a point where replacement of the  runway was considered necessary.

4 5 6 7

RECONSTRUCTION OF RUNWAY 9R-27L

Overall Construction Approach

While replacement of Runway 9R-27L was conceptualized in early 1998, a typical reconstruction schedule of some 6 to 7 months was not acceptable because the runway handled one-fourth of the daily flight operations and was also only one of two CATIIIB certified runways that provided pilots with the best landing capability in severe weather. The project designer, Aviation Consulting Engineers, Inc. (ACE) in association with the Department of Aviation is credited with the planning, design, and construction management of the Runway 9R-27L Reconstruction Program. An unprecedented planning effort began over 18 months in advance of construction and included close coordination and consultation with the City of Atlanta, major airlines, and FAA.  A  joint venture of major contractors included APAC Ballenger, C.W. Matthews Contracting, Swing Construction, and Mitchell Construction. Together, this team was selected to remove and replace the 2,740-m by 46-m (9,000-ft by 150-ft) wide Runway 9R-27L, over 167,000 sq m (200,000 sq yd) of 400- to 560-mm (16- to 22-in.) thick concrete pavement in only 36 days.

During this period, normal operations would be transferred to Taxiway R, just south of Runway 9R-27L, that was readied to serve as a temporary runway during this period. This fast-track alternative approach was bid at $ 52 million. A conventional approach was estimated to cost between $ 15 to $ 20 million, without factoring the impact of a closed runway at some $ 475,000 per day over a normal 6 month construction time frame. So actually, the fast-track bid was significantly less expensive to the owner. Because time was so critical, penalties for not meeting the construction schedule ran as high as $ 200 per minute.

Removal of Existing Pavements

A critical phase of the construction project was the removal of some 21,150 concrete panels, each measuring 2.3 m by 3.7 m (7.5 ft by 12 ft) by 406 mm to 559 mm (16 to 22 in.) thick. A specialty contractor, Penhall Company, was chosen for this task based on their experience in California with removal of earthquake-damaged bridges and interstates following major California earthquakes. Penhall mobilized multiple teams of operators and equipment from across the country to complete the task. Once the  existing concrete slabs were cut, unique pavement removal buckets were utilized to carry away a maximum of three 9,150-kg (20,150-lb) panels onto each flat bed truck for transport to a 5.7-ha (14-ac) stockpile yard accommodating some 1,900,000 kN (213,000 tons) of panels stacked on top of one another, sometimes as high as 13 panels (refer to Figure 4).

8 9

Figure 4  Removal of Existing Pavements

Concrete Mix Design and Construction Operations

A total of 13 trial concrete mix design were formulated.  Flexural strength data from  this mix design phase indicated that a target 7-day strength of 4,130 kPa (600 psi) as well as a target 28-day strength of 4,480 kPa (650 psi) could easily be achieved.

The newly-constructed runway was designed to have an average thickness of 46 cm (18 in.) and a design life cycle of well over 20 years.

The resource needs for this project were significant, including: I) 1,200+ workers working 24 hours per day, 7 days per week at the height of construction ; 2) 200 to 300 truck loads of materials per day; iii) three on-site concrete batch plants (refer to Figure 5), plus an existing off-site commercial batch plant as backup, each capable of  producing as much as 7.7 cu m (10 cu yds) per min.

Phase I operations for the project focused on a temporary modification of an adjacent taxiway which would serve as a replacement runway during construction. This phase lasted 70 days and included procurement and mobilization. Phase II comprised the actual runway reconstruction for a planned 36 day timeframe. Phase III was scheduled for 30 days to convert the temporary runway back to a taxiway, to remove runway lighting and install taxiway lighting, convert runway striping to taxiway markings, and remove temporary exits.

10 11

Figure 5  Batching and Placement of Concrete

QUALITY CONTROL TESTING 

Quality Assurance testing for the owner and Quality Control testing for the contractor were performed during several key phases of construction, including subgrade preparation, installation of a soil-cement base, bituminous pavement placement and, of course, concrete pavement placement.

In accordance with FAA P-501 specifications, testing during construction included casting beams for flexural strength. Between QA and QC functions, over 2,000 beams were cast.  Target design flexural strengths were 4,130 kPa (600 psi) at 7 days and  4,480 kPa (650 psi) at 28 days when tested in accordance with ASTM C 78. Tables 3 and 4 summarize QC strength data.

Table 3  Summary of Quality Control Flexural Strength Data

Test at Days N, sample size Range kPa / psi Average kPa / psi S.D. kPa / psi
1 166 1,930 – 4,892 3,197 544
280 – 710 464 79
3 166 2,825 – 5,994 611 599
410 – 870 4,210 87
7 318 3,514 – 6,201 665 482
510 – 900 4,582 70
28 349 4,823 – 7,648 811 530
700 – 1,110 5,588 77

Table 4  Summary of Quality Control Splitting Tensile Strength Data

N, sample size Range kPa / psi Average kPa / psi S.D. kPa / psi
56 25,011 – 41,340 31,350 3,569
3,630 – 6,000 4,550 518

Results of the strength testing for flexural strength on beams indicated that the ultimate 28-day target compressive strength of 4,480 kPa (650 psi) was generally achieved between 3 days and 7 days.

ACKNOWLEDGEMENTS

The authors acknowledge the cooperation of the entire design and construction team which was essential to the success of the 9R-27L Reconstruction project. Planning, design, and construction management were performed by Aviation Consulting Engineers, Inc. (ACE) in association with the Department of Aviation on behalf of the owner, City of Atlanta. A plaque was placed on the completed runway project to recognize and honor Mr. Frank Hayes with ACE for over 25 years of engineering service at ATL.

The construction team was led by a joint venture of 4 firms, including APAC Ballenger,

C.W. Matthews Contracting, Swing Construction, and Mitchell Construction, all from Georgia, USA.

CONTINUE READING

Categories

  • News
  • Technical Paper

About

2MNEXT (Materials Managers and Engineers, Inc.) was established in 2010 in Atlanta, Georgia to provide engineering and inspection services in the areas of geotechnical, environmental, pavement management, materials engineering and testing, and special inspections.

Sitemap

  • Home
  • Services
  • News
  • Careers
  • About
  • Contact

Contact

Materials Managers and Engineers Inc. (2MNEXT)
1) 2623 Lake Flair Circle, Atlanta, GA 30345
2) 3715 Northside Parkway, 300 Northcreek, Suite 200, Atlanta, GA 30327
404.961.5279
info@2mnext.com

© Copyright 2MNEXT 2017

  • Home
  • Services
  • News
  • Careers
  • About
  • Contact