Pavement Management: Key to Sustainable Concrete Pavement at the World’s Busiest Airport
January 1, 2012Technical Paper
W. Charles Greer, Jr.
P.E. Senior Vice President, AMEC E&I, Alpharetta, GA
Subash Reddy Kuchikulla
President, Materials Managers and Engineers, Inc., Atlanta, GA
Jim Drinkard
Assistant General Manager, Hartsfield-Jackson ATL Airport, Atlanta, GA
Abstract
The Hartsfield-Jackson Atlanta International Airport (ATL) is the busiest airport in the world in terms of passengers and aircraft operations. In 2010, it served more than 89 million passengers with 950,119 aircraft operations. Reliable performance with little down time for its airfield pavements is critical to providing efficient, safe, and economical travel. Concrete pavements have long been the keystone of this capability at ATL. This paper presents the design, construction, maintenance, and evaluation procedures and activities that comprise the Pavement Management System (PMS) used at ATL to provide sustainable concrete pavements. The sustainability issues include long life pavements that have impacts far beyond those of the concrete pavement itself and the airport. Sustainable concrete pavements result in reduced down time, fewer construction delays, less fuel used waiting for takeoff, and fewer materials consumed as a result of the reduced frequency of construction/reconstruction and maintenance. These results help reduce the overall carbon footprint of the airport and its impact on the carbon footprint of other airports and aircraft operations throughout the worldwide air travel system.
Introduction
The northern departure runway (RW-8R) was reconstructed in 1969 in 40 days and 40 nights while the airport operated with one main runway. Hence, it was termed “The 40- Day Wonder”. RW-8R was replaced in 2006 at an age of 37 years, well beyond its original 20-year design life.
The southern departure runway (RW-9L) was reconstructed in 1974 in about 6 months. RW-9L was extended in 1985 by 1800 feet on the west end and 2100 feet on the east end. The 8000 feet that was reconstructed in 1974 is still in service at an age of 37 years, also well beyond its 20 year design life. The extensions still serve aircraft today. Both runways are estimated to have served more than 5 million departures each and are a testament to the fact that concrete pavement is and will continue to be very sustainable.
In 1984, RW-8R was thought to be near the end of its serviceable life (John Culpepper, personal discussions, 1984). Thus, ATL initiated a program of pavement evaluation that has evolved into a very comprehensive Pavement Management System (PMS). This program and its feedback to the design, construction, maintenance, and evaluation processes have allowed ATL to significantly extend the life of its 2 main departure runways (RW-8R and RW-9L). The PMS has saved ATL more than $100 million in replacement costs and has made positive impacts for sustainability for these runways as well as for other pavements that have been or will be constructed at ATL. These impacts include reduced use of construction materials and less wasted fuel from aircraft delays 2 due to construction interference. Nearly one whole generation of pavement replacement has been skipped. The reduced delays have an impact that extends far beyond ATL as issues at ATL affect the worldwide air travel system.
Pavement Management System – General
The PMS is the key to long life sustainable concrete pavements at ATL. The program started in 1984 and has evolved into a very comprehensive PMS. In its 27 years, it has provided ATL technical personnel and its consultants with the ability to objectively analyze and evaluate the concrete pavements. It has removed much of the subjective evaluation that is often associated with pavement evaluation and has been fundamental to decisions that have significantly extended the life of concrete pavements at ATL.
The PMS program has utilized new techniques over the last 27 years. These include falling weight deflectometer (FWD) testing, coring, soil boring, split-spoon and undisturbed soil sampling, alkali-silica reactivity (ASR) evaluations, profile measurements and roughness determinations, and high speed digital imaging of the pavement surface conditions. The techniques also include specialized laboratory testing including resilient modulus testing of undisturbed soil samples; elastic modulus determinations on concrete cores as well as cement treated base and soil-cement cores; compressive strength testing of concrete cores, cement treated base and soil-cement cores; split tensile strength testing of concrete cores; scanning electron microscope (SEM) procedures; and energy dispersive x-ray (XRD) analysis.
The results of these evaluations along with improved procedures for design, construction, and maintenance have resulted in very long life concrete pavements for the World’s Busiest Airport. It should be remembered that RW-8R was considered to be at the end of its serviceable life when the PMS evaluations were started in 1984. It served another 22 years and could have gone a little longer had it not been replaced due to operational issues that would occur elsewhere on the airport if the reconstruction were delayed.
Pavement Management System – 1984 Pavement Evaluation
In 1984 the fourth runway (RW-8L) for ATL had just been completed. RW-8R was 15 years into its 20-year design life and thought to be near the end of its useful life. It had served its original 20 years of traffic in 15 years and exhibited significant surface cracking along with cracking of some of the longitudinal keyway joints. Management personnel at the airport were ready to replace it. However, they decided to embark on a program of specialized testing and evaluation to determine if RW-8R should be replaced.
The initial evaluation in the summer of 1984 encompassed the 4 runways and a few key taxiways. The testing utilized the falling weight deflectometer (FWD); coring of the concrete, cement treated base course, and soil-cement subbase; strength testing of these cores; and hand auger soil borings with dynamic cone penetrometer testing of the subgrade to depths of 4 to 8 feet along with undisturbed soil sampling. Petrographic examinations were performed on concrete cores not subjected to strength testing.
The data were analyzed to develop recommendations for RW-8R. The data for the other pavements were utilized in the overall analysis, but no recommendations were developed for pavements other than RW-8R. All data were archived for future evaluations. The FWD data at maximum loads of approximately 25,000 pounds indicated good structural capacity for RW-8R with center-of-slab stiffness values in the range of 5,000 kips/inch. The other 3 runways exhibited center-of-slab stiffness values in the range of 6,000 to 7,000 kips/inch. The basic thickness design of RW-8R was 16 inches of concrete over 6 inches of unbound granular base course over 6 inches of soil-cement on prepared subgrade. The other three runways were similar except 6 inches of cement treated base course was used in place of the 6 inches of granular base. Joint efficiencies for all of the runways were in the range of 85 to 92 percent.
The reasonably good FWD data for RW-8R were counter to the observed cracking in the surface of the concrete. However, the petrographic analysis of the concrete cores indicated that the cracks extended to depths of 3 to 5 inches below the surface of the pavement and stopped. The cracks were also generally very tight. They were attributed to early age drying shrinkage. Thus, the structural capacity of the pavement was assessed to be much better than indicated by the visual condition of the surface. Low severity alkali-silica reactivity (ASR) was observed in some of the cores during the petrographic examinations. It was recommended that this condition be monitored.
It was concluded that RW-8R could serve 5 more years if nominal repairs were made. The recommended repairs involved replacing 10-15 slabs (portions of only 2 slabs were actually replaced), sealing cracks with widths greater than ¼ inch with a flexible sealant, and repair of cracked longitudinal keyway joints with a block type repair that had been developed earlier at ATL specifically for failed keyway joints, and re-sealing of all joints. It was recommended that testing and evaluation be performed again in 3 years to assess the continued performance of all of the pavements and whether RW-8R would serve the full 5 years. The testing in 3 years would allow development and documentation of performance history curves.
Pavement Management System Development and Evolution
The program was repeated in 1987, 1990, 1994, 1997, 2001, 2004, 2007 and 2010. The evaluations resulted in RW-8R serving until 2006 when it was replaced at an age of 37 years so that the reconstruction would best fit the overall construction program and operational requirements of the airport. The program has been the basis for the continued life of RW-9L, the interior 8,000 feet of which is now 37 years old. The program identified ASR issues in RW-9R in 1990. RW-9R was replaced in 5 weeks in 1999. The PMS program was instrumental in providing objective data upon which to base the final decision to replace the runway when it was 27 years old, significantly beyond its original 20-year design life. During the 27 years of the PMS program numerous new techniques have been added to improve the evaluation process. These are summarized in Table 1.
Table 1 – Summary of Techniques Utilized for ATL PMS Program and Year Introduced.
| Technique | 1984 | 1987 | 1990 | 1994 | 1997 | 2001 | 2004 | 2007 | 2010 |
| Visual Surveys1 | X | X | X | X | X | X | X | X | X |
| Automated Video2 | X | X | X | ||||||
| Crack Surveys3 | X | X | X | X | X | ||||
| FWD4 | X | X | X | X | X | ||||
| HWD5 | X | X | X | X | |||||
| RDD6 | X | ||||||||
| Ride Quality7 | X | X | X | X | X | X | |||
| Cores/Borings8 | X | X | X | X | X | X | X | X | |
| Laboratory Tests9 | X | X | X | X | X | X | X | X | |
| Concrete Studies10 | X | X | X | X | X | X | X | X | |
| SEM/EDX11 | X | X | X | ||||||
| Photo History12 | X | X | X | X | X | X | X | X | X |
| MicroPaver | X | X | X | X | |||||
| GIS | X | X | X | X |
1 – Pavement Condition Index (PCI) procedures were formally instituted in 1990.
2 – Automated Digital Video Mapping with High-Speed Imagery.
3 – Crack surveys with location and conditions tied to database and GIS.
4 – Falling weight deflectometer, approximately 25,000 pound capacity.
5 – Heavy weight deflectometer, approximately 60,000 pound capacity.
6 – Rolling dynamic deflectometer.
7 – Profile measured and analyzed to locate excessive rough areas.
8 – Cores of pavement along with soil borings and undisturbed samples of subgrade.
9 – Strength tests of cores and soil subgrade.
10 – Petrographic examinations of concrete cores.
11 – Scanning electron microscopy and energy dispersive x-ray analyses.
12 – Cameras with GIS capability were introduced in 2010.Deterioration from ASR
The key to successful utilization of the PMS at ATL to provide long life sustainable concrete pavements has been the introduction of new techniques as they become available and the balanced application of these techniques. Any one technique by itself may lead to conclusions that are counter to conclusions from other techniques. In 1984 the subjective visual condition of RW-8R and its traffic history pointed towards the need for replacement at that time. However, the use of the FWD, material properties determinations, and petrographic examinations of the concrete cores indicated that the runway still had significant useful life.
Visual Surveys: Visual surveys of the pavements by walking were initiated in the 1984 evaluation program. Defects such as cracks, spalls, and joint deterioration were observed and documented. In 1990, the Pavement Condition Index (PCI) procedure was implemented for the runways and extended to the taxiways in 1994. The PCI process has 5 been very useful in allowing objective assessments of the pavement conditions to be made along with estimates of when significant repairs, rehabilitation, or replacement should be planned. This objective process has been one of the key elements in determining that the useful service life of the concrete pavements at ATL could be extended well beyond their original design life. MicroPAVER was implemented in 2001 at ATL to allow a more automated approach for analyzing and managing the pavement data and predicting when critical condition indices might be reached. A typical PCI versus time curve is shown in Figure 1. This data indicated that the PCI values for RW- 8R in the 2004 evaluation were approaching the level at which major rehabilitation or reconstruction would be necessary.
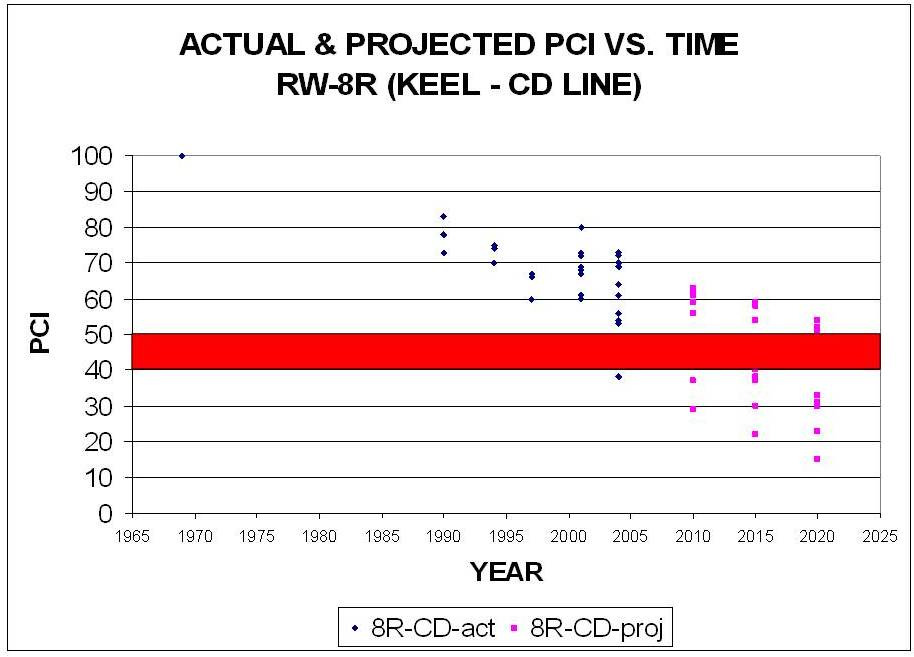
Figure 1 – Actual & Projected PCI vs. Time for RW-8R – 2004 Evaluation
Automated Digital Video Mapping: The use of automated digital video imaging of the pavement surface was initiated in 2001 for RW-8R and RW-9L and extended to all four runways in 2004. It was used again in 2007 for RW-8L, RW-9L, RW-9R, and RW-10 (new 5th Runway completed in 2006). The data were collected at night with a van traveling at 40 to 60 mph with a scan width of 13 to 15 feet. This technology was used to supplement the walking surveys. Some defects observed in the walking surveys cannot be documented in the automated process. The van and equipment are shown in Figure 2. An entire runway can be mapped in 1 to 2 hours at night when operations are low.
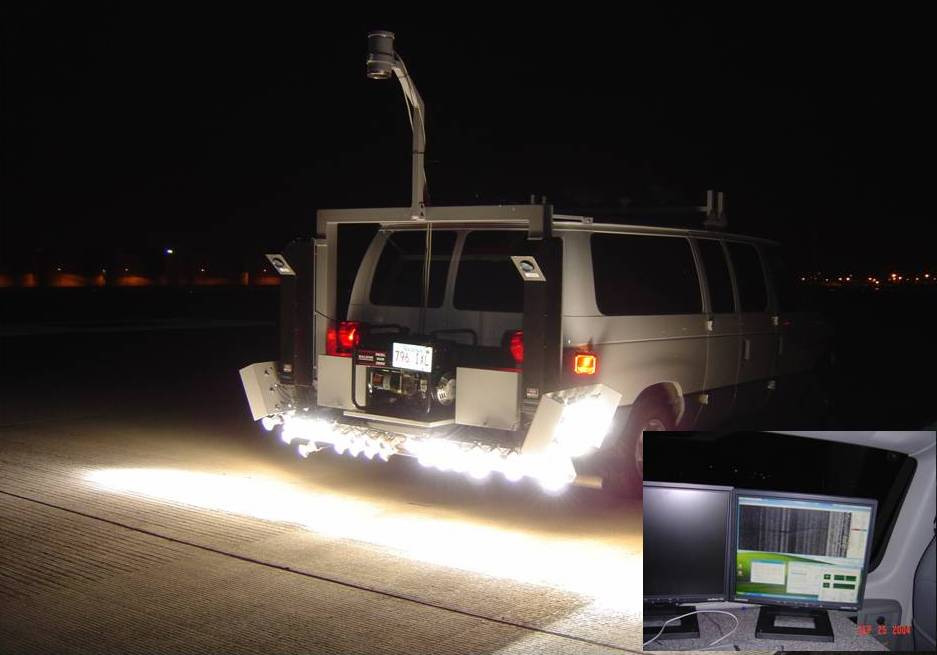
Figure 2 – Automated Digital Video Mapping Van and Recording Equipment
This technology allows the entire pavement surface condition to be documented and compared over several years in order to assess rates of deterioration. Distresses were also quantified using procedures similar to the Pavement Condition Index (PCI) process in MicroPAVER. Figure 3 shows the cracking distress at one location in 2001 and 2004. Figure 4 shows the cracking distress at another location in 2004 and 2007. These photographs indicate that there was very little change in the condition of the cracks over the three-year intervals. It is also evident that a wide range of crack width conditions can be documented with this technique. The authors have found that projecting the images on a large wall at large magnification makes it easier to see the “big picture” as opposed to the feeling that one is “looking at the pavement through a microscope”.
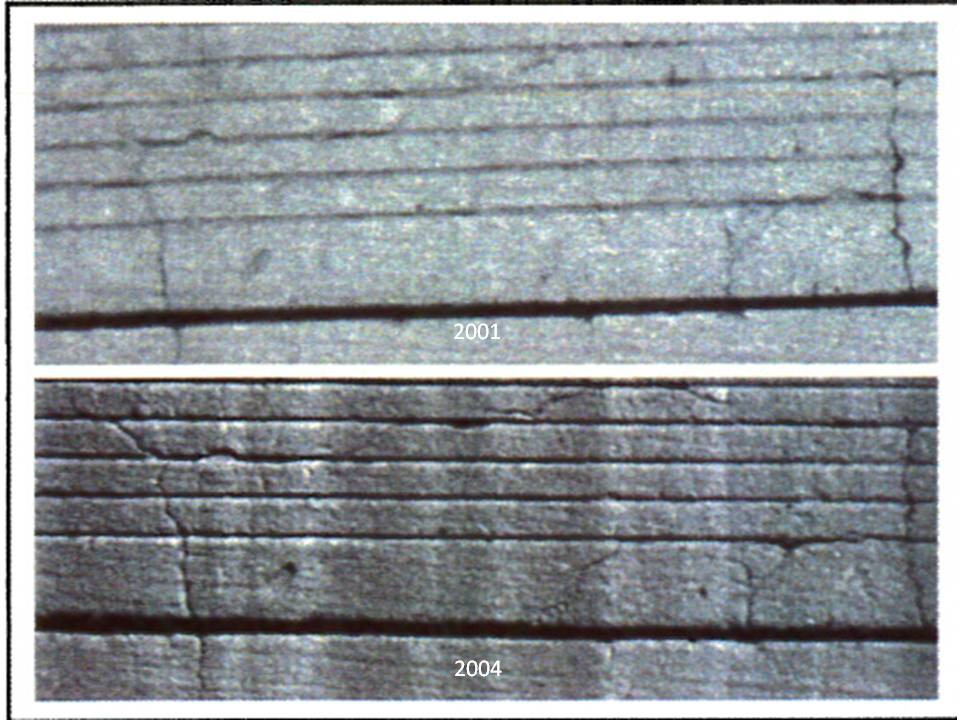
Figure 3 – Automated Video Mapping Output for a Location in 2001 and 2004
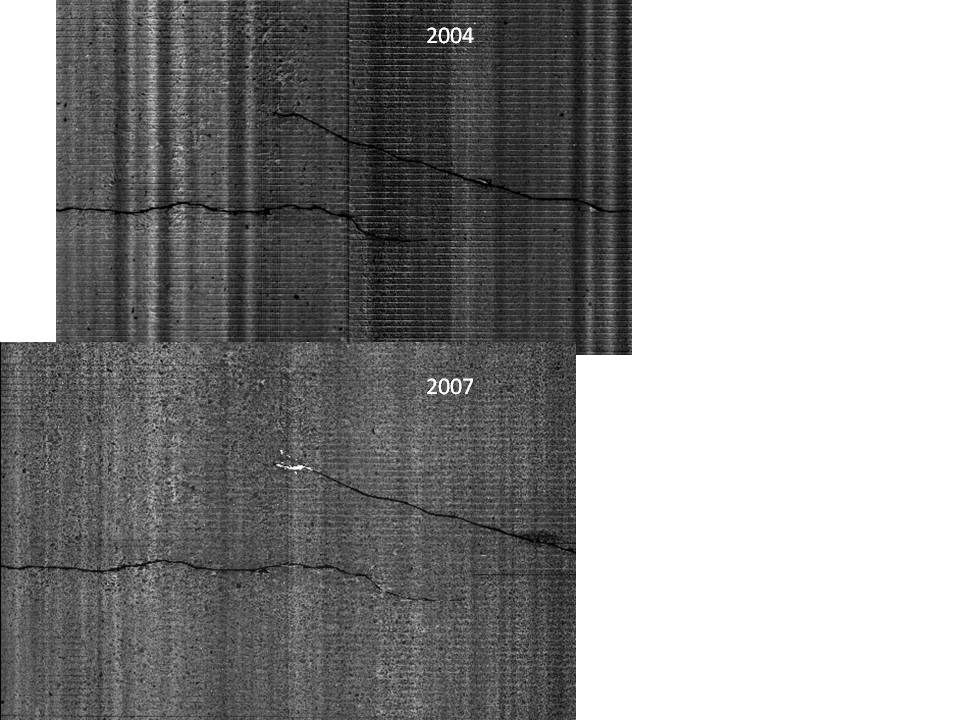
Figure 4 – Automated Video Mapping Output for a Location in 2004 and 2007
Crack Surveys: In 1995, ATL began conducting detailed inspections intended to quantify cracks, spalls, and patches with ratings of good – fair – poor. The surveys have typically been conducted in the Fall of the year. They consist of a surveyor on foot with a GPS antenna and a steel dowel bar. The dowel bar is used to “sound” patches and joints for hollow sounds that could indicate cracks and delaminations. If a defect is found, the condition is documented as to severity and extent and the location is recorded with the GPS. A typical record of cracking for RW-8L is shown in Figure 5. These data are used to help establish periodic maintenance activities.
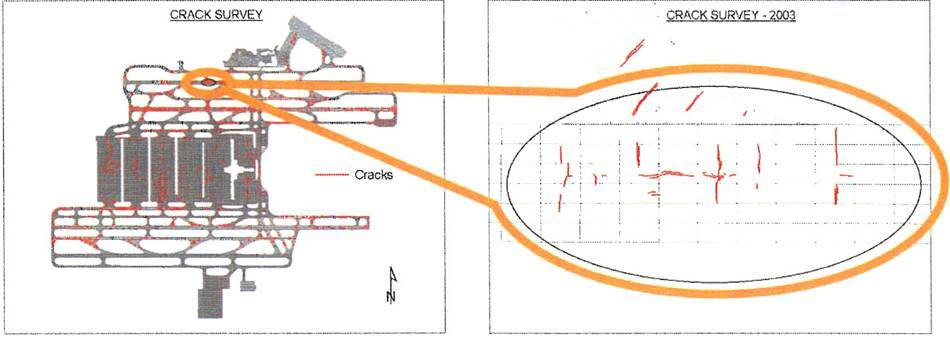
Figure 5 – Crack Survey Map with Detail for RW-8L Based on Database and GPS
Falling Weight Deflectometer Testing: The falling weight deflectometer with a load capacity of 25,000 pounds (FWD) was first used in the 1984 evaluation. The FWD is a device that drops a weight on the pavement surface. The force of the weight is transmitted to the pavement surface through a steel plate with hard rubber pad and spring system. The diameter of the plate is approximately 12 inches. The height and weight can be varied so that a force up to approximately 25,000 pounds is achieved. The deflection of the pavement surface is measured at the center of the load plate and at offsets up to a few feet. The deflection sensors can be set across joints (longitudinal, transverse, and corners) so that joint efficiency for concrete pavements can be measured. In 2001, the Heavy Weight Deflectometer (HWD) was initiated into the PMS in lieu of the FWD in recognition of the increasing weights of current and future aircraft. The HWD can approach forces of 60,000 pounds on a plate with a diameter of approximately 18 inches.
The Rolling Dynamic Deflectometer (RDD) was utilized in 2001 for RW-8R and RW- 9L. Three longitudinal profiles were obtained for each of these 2 runways. The RDD provides a continuous stiffness/deflection data stream. However, it was determined that the HWD provided sufficient and effective data for analysis and evaluation.
Runway Ride Quality Measurement: In 1994, ATL added surface profile measurement and roughness/smoothness analysis for the runways to the program. This was done to determine ride quality which is usually based on “bumps” over longitudinal distances of 50 to 150 feet versus roughness or smoothness which is typically measured over distances of 10 to 15 feet or less. The profile was measured with proprietary equipment that utilizes a laser to radiate a plane of light and a cart system that has light sensitive cells on it (See Figure 6). Once the cart system has locked onto the laser, the cart is pushed along the longitudinal direction of the pavement and the system records the elevation of the cart every foot. The data are analyzed to determine the aircraft responses with proprietary software.

Figure 6 – Laser Source (left) and Cart System (right) for Profile Measurements
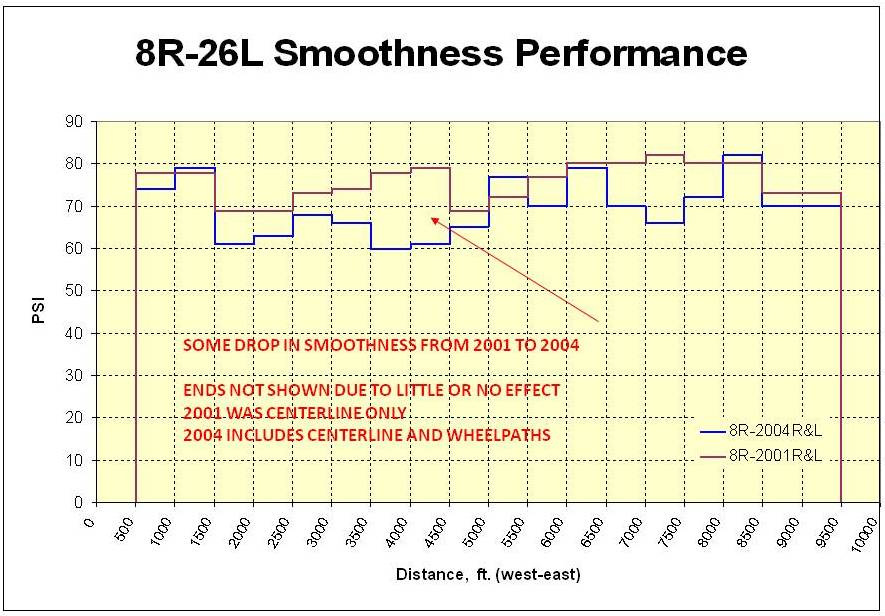
Figure 7 – Pavement Smoothness Index (PSI) versus Position, RW-8R, 2001 & 2004
The profile analysis output can be expressed as a Pavement Smoothness Index (PSI). Plots of PSI versus longitudinal position for RW-8R for 2001 and 2004 are shown in Figure 7. Changes in PSI with time can be monitored and aid in determining when to repair or replace a pavement due to excessive roughness. A pavement that is structurally very strong and exhibits little or no surface defects may be unacceptably rough. The runways at ATL have typically exhibited good smoothness.
Field Coring, Drilling, and Sampling: Coring of the concrete, cement treated base, and soil cement has been used in every evaluation except 1987. The subgrade soils were tested with standard soil test borings and undisturbed sampling. Test locations were generally located to investigate specific conditions observed in the visual surveys, particularly cracks, or anomalies noted in the FWD/HWD testing. The samples were returned to the laboratory for characterization tests. Occasionally it becomes necessary to do something out of the ordinary such as obtaining a large concrete core (26-inch diameter) in order to evaluate a problem such as corner cracking of concrete slabs on a taxiway. The investigation indicated that the slabs had curled and the corners were under the main gears of the aircraft.
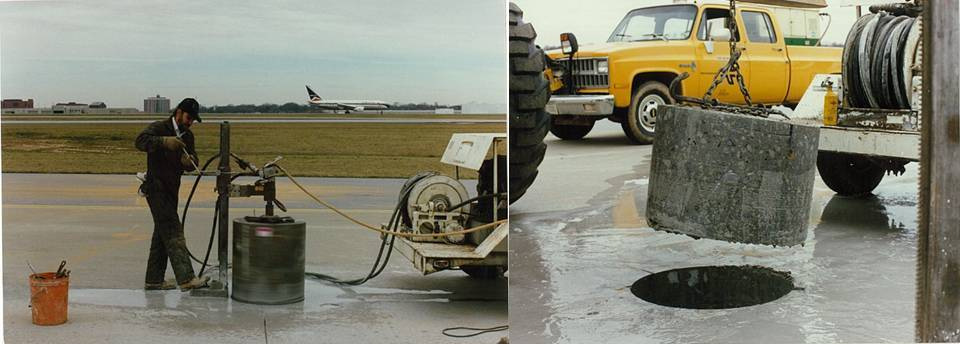
Figure 8 – Large 26-inch Diameter Core for Taxiway Cracking Investigation
Laboratory Testing: In the laboratory, strength and modulus of elasticity tests were performed on the cores of concrete, cement treated base, and the soil-cement. Split tensile strength tests were also performed on cores of the concrete. The results of these tests over the years have been correlated to quality control and quality acceptance tests performed during construction. The correlations have helped assure that the construction specifications are appropriate and have provided material relationships for evaluations of materials at the time of construction to determine their acceptability. The tests have been performed in every evaluation except 1987. Resilient modulus (Er) tests on the undisturbed samples of the subgrade were first performed during the 1990 evaluation and in every evaluation since (See Figure 9). The Er tests were used for layered elastic analyses of the pavements.
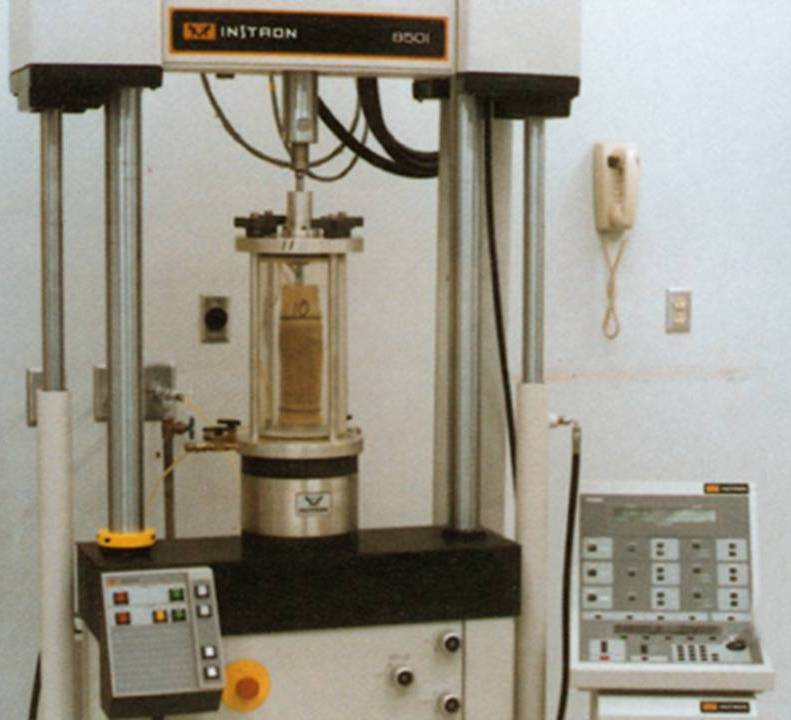
Figure 9 – Resilient Modulus Test Equipment for Subgrade Soil Characterization
Petrographic Examinations: Cores of concrete not tested for strength were cut and polished to very smooth surfaces. They were examined petrographically with a binocular optical stereo-microscope at 10x-60x. This was done to observe the nature of cracks, assess the presence of reactions between the paste and aggregates, and evaluate secondary deposits in the air voids from ettringite formation. These procedures have been very useful in assessing the extent and severity of ASR issues in the concrete. Micro-photographs were taken of key conditions and observations. Figure 10 shows the microscope and condition in one of the cores with secondary deposits in a crack.
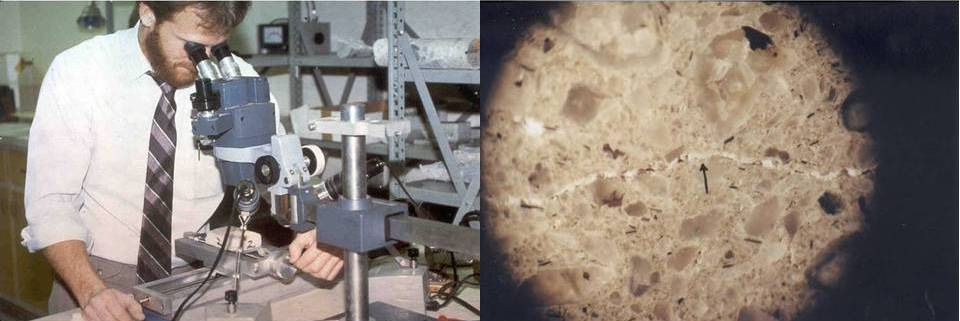
Figure 10 – Petrographic Examination of Concrete Core with Binocular Microscope
Scanning Electron Microscopy and Energy Dispersive X-ray Analysis: In 2004, analyses of concrete cores with scanning electron microscopy (SEM) and energy dispersive x-ray (EDX) procedures were initiated. The SEM procedures were used to examine the polished surfaces of the concrete to assess the nature of cracks, voids, and reaction rims around the aggregates in the concrete. The EDX procedures were used to assess the chemical make-up of the surface including deposits in the cracks and voids. These analyses also allowed an in-depth assessment of the extent of ASR. Figure 11 shows the SEM/EDX equipment and output.
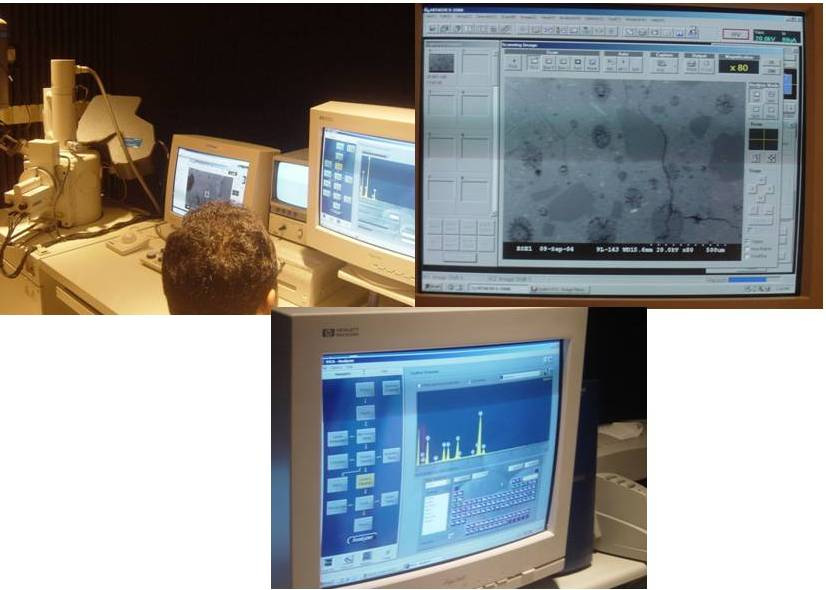
Figure 11 – SEM/EDX Equipment and Output for Concrete Core Analysis
Photographic Documentation: In the 1984 evaluation, conditions of the concrete cores in the laboratory analysis were documented with photographs. In 1987, field conditions of the pavement were also documented with photographs, particularly key areas that exhibited distress or unusual patterns of cracking. Over the years photographs were taken at locations in very close proximity to the previous photographs of the pavements. This allowed comparative assessments to be made relative to the extent and rate of deterioration condition of the pavement at these locations.
Figure 12 shows a patch for RW-8R in 1990 and again in 2004. Although the lighting effects and coloration are different in the two photographs, it is clear that the patch has performed very well during the 14-year time frame.
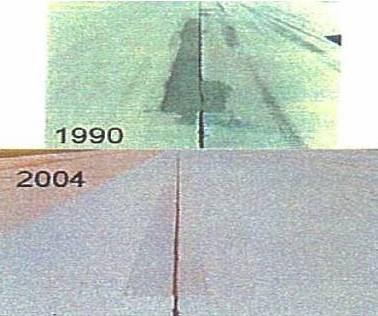
Figure 12 – Condition of Patch at Slabs 47B/C in RW-8R in 1990 and 2004
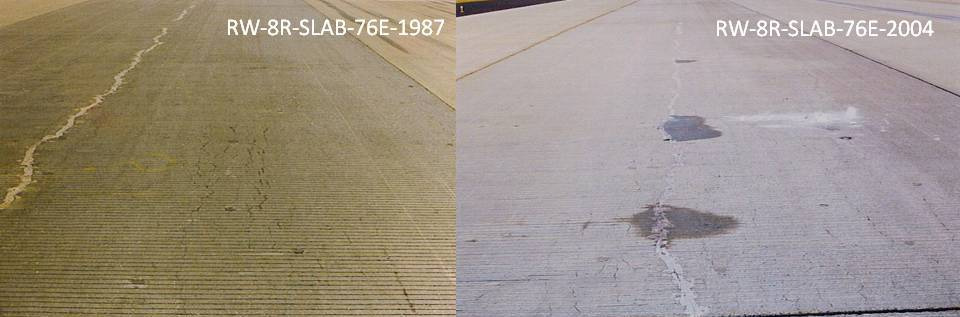
Figure 13 – Condition of Surface Cracking in RW-8R in 1987 and 2004
Figure 13 shows surface cracking in RW-8R in 1987 and again in 2004. Again the lighting and coloration are different, but the cracking and the crack repair did not greatly worsen over the 17 years between the photographs. The photographic history has been invaluable in supplementing the PCI data and the overall evaluation of deterioration rates.
Pavement Management System Summary
The PMS has been the most useful tool for providing sustainable concrete pavement at ATL. Figure 14 presents a composite summary from the 2004 evaluation. This summary allows one to visualize several condition/performance factors at one time. Distress in one parameter can be compared with other parameters for correlation. The extent of poor condition can also be seen. This summary picture can greatly aid in deciding that the life of concrete pavements can be extended. The PMS has also been a great investment for ATL; it has saved more than $100 million in replacement costs over the years by allowing the airport to skip a whole generation of replacement for its 2 main departure runways.
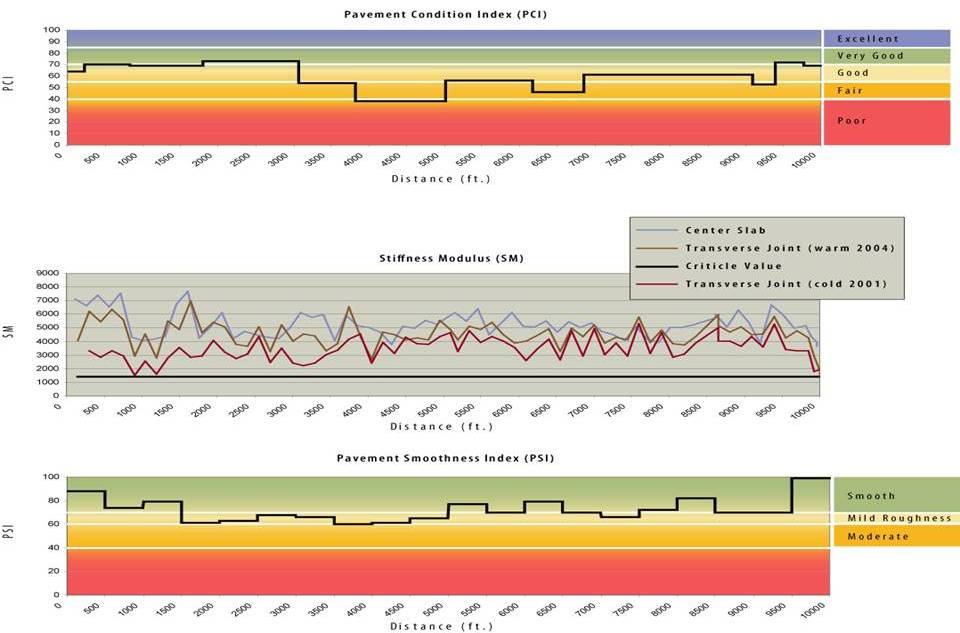
Figure 14 – Composite summary of the PCI, FWD Center-of-Slab Stiffness, and PSI for RW-8R for 2004 Evaluation
It is the opinion of the authors, that the PMS and the longevity and continuity of the ATL staff and their institutional knowledge have helped provide long life and sustainable pavements at ATL.
Acknowledgements:
The authors personally acknowledge Mr. Frank Hayes who has served at ATL in many capacities since 1974 for his support and contributions to sustainable long life concrete pavements at ATL and the PMS program.
The authors also acknowledge the City of Atlanta Department of Aviation for the support and contributions of its many staff members over the years who have also greatly supported and contributed to the PMS and sustainable concrete pavements at ATL.